-
11 min read
GreenOps best practices: Cut cloud costs and carbon

TL;DR
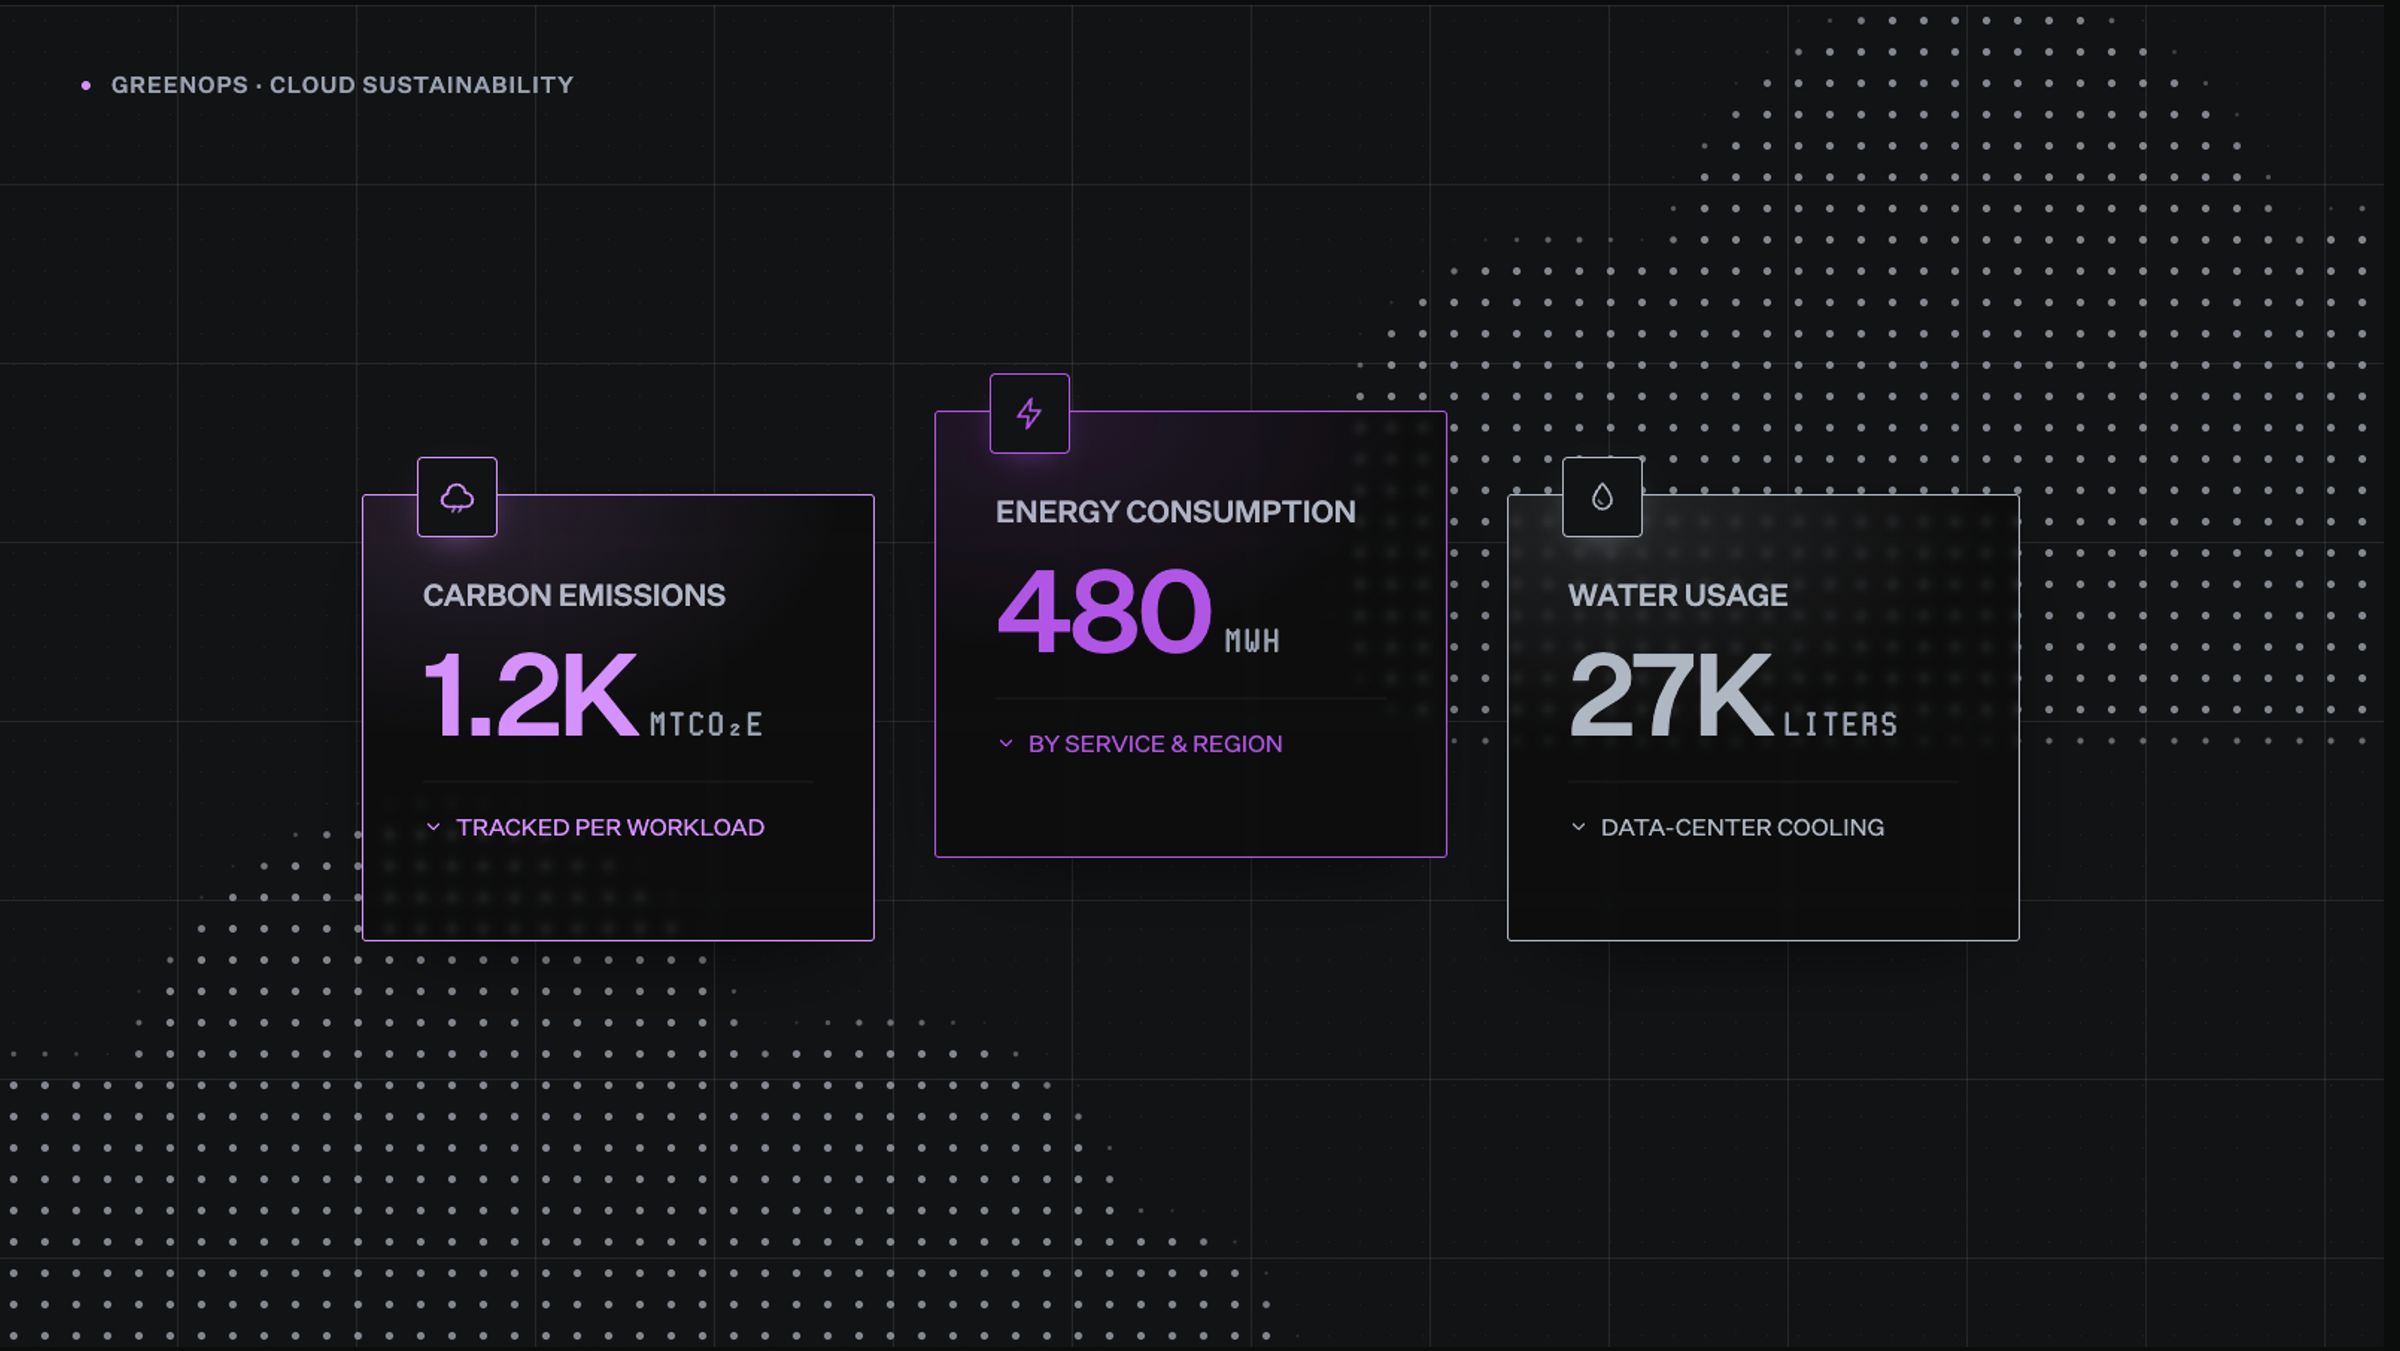
- GreenOps connects cloud cost with carbon emissions, energy consumption, and water usage.
- The same actions that cut waste, such as rightsizing and removing idle resources, often reduce environmental impact too.
- Teams can add sustainability metrics to existing FinOps workflows without creating a separate operating model.
- North.cloud’s GreenOps tracks impact across workloads, regions, services, and resources without requiring perfect tagging.
- North’s Flexbot and Autobot preserve month-to-month flexibility, making it easier to scale infrastructure down as usage changes.
- Teams can also purchase verified offsets and export reports, receipts, and carbon-neutrality certificates directly from North.
Cloud waste often appears in familiar forms: idle resources, oversized clusters, and duplicated deployments that were never consolidated. Most engineering teams can see the financial case for addressing that waste, but its environmental impact is much harder to trace because carbon, water, and energy data rarely appears alongside the cloud bill.
GreenOps closes that gap by connecting infrastructure efficiency with environmental impact. The same changes that reduce cloud spend can also lower emissions, energy consumption, and water usage across the data centers supporting each workload.
That includes:
- Rightsizing overprovisioned compute
- Eliminating idle resources
- Consolidating redundant deployments
By bringing cost and sustainability data into the same view, GreenOps helps teams understand where waste is occurring and which changes can improve both financial and environmental performance.
This guide explains what GreenOps means for engineering, infrastructure, and FinOps teams, why it matters, and how to integrate it into existing workflows without creating a separate toolchain.
What is GreenOps?
GreenOps is the practice of measuring and reducing cloud infrastructure’s environmental impact alongside cost. It tracks carbon emissions, energy consumption, and the water used to support data center operations.
In practice, GreenOps brings these metrics into existing cloud management workflows. Teams can:
- Track impact by workload, service, and region
- Allocate environmental impact across teams
- Review sustainability data alongside cloud spend
GreenOps is not a separate sustainability initiative. It extends the infrastructure optimization work teams already perform, making its environmental impact visible, actionable, and reportable.
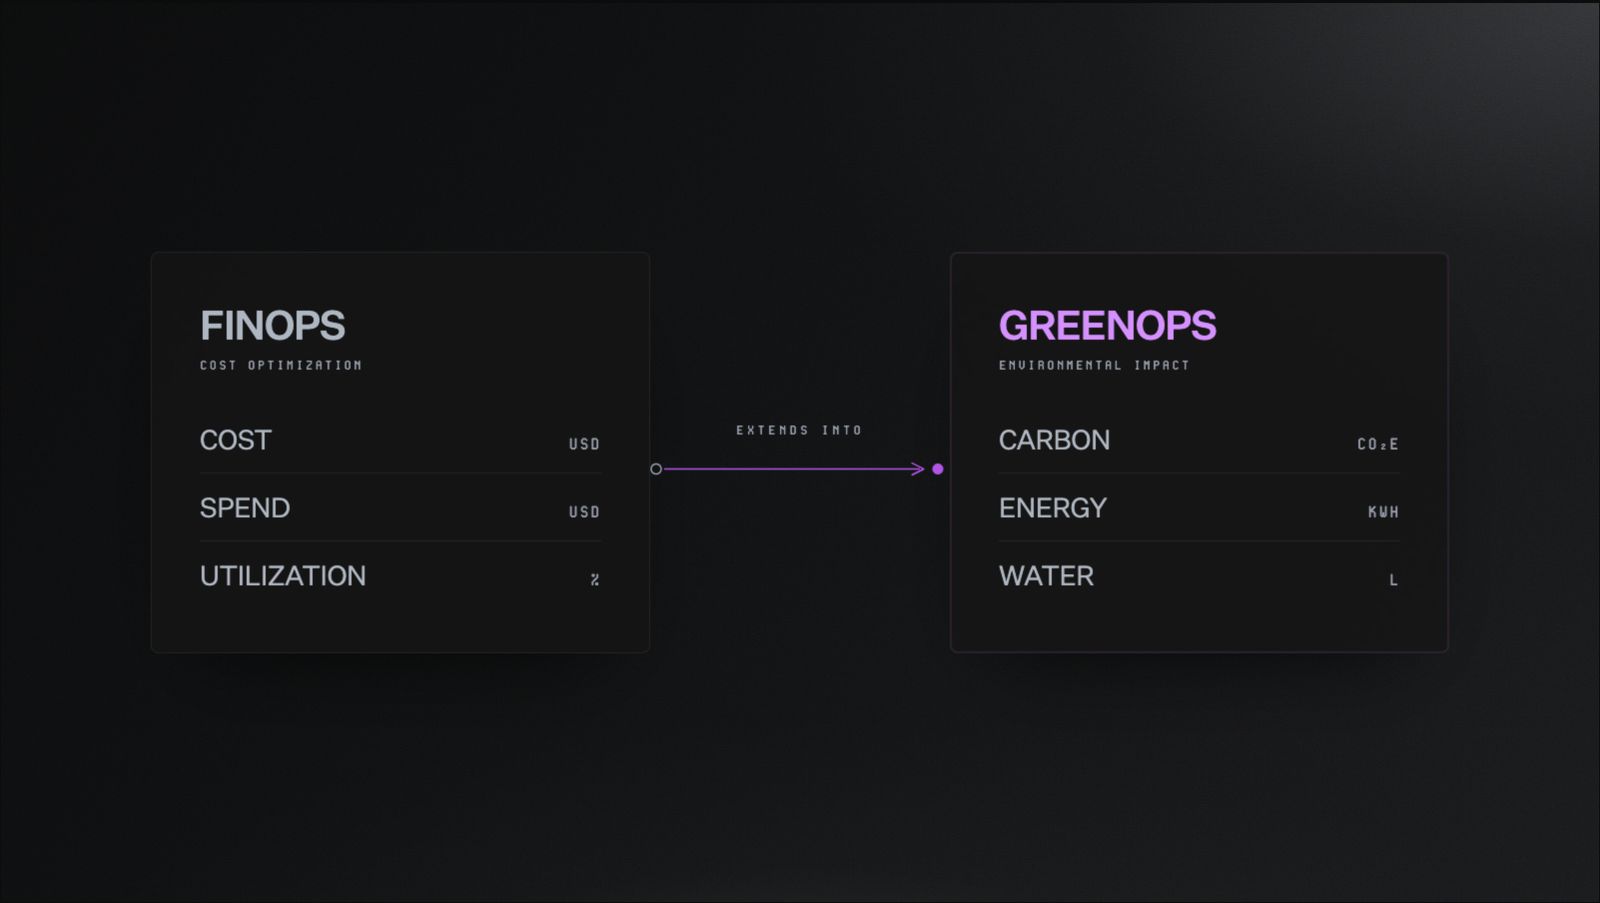
GreenOps adds carbon, energy, and water tracking to the same framework engineering teams already use for cost.
The environmental footprint of the cloud: Why GreenOps matters
Despite its name, the cloud depends on physical data centers. Those facilities consume electricity, use water for cooling, and rely on hardware that must be maintained and replaced.
These environmental costs rarely appear alongside the cloud bill. As a result, teams can see what infrastructure costs without seeing the resources required to support it.
Cloud waste has three price tags
The environmental footprint of cloud infrastructure extends beyond carbon emissions. It also includes:
- Water consumption: Data centers use water for cooling, with greater impact in water-stressed regions.
- Energy consumption: Idle and oversized resources continue drawing power without delivering proportional value.
- Hardware use: Unnecessary infrastructure increases demand on physical equipment throughout its lifecycle.
The same inefficiencies also increase cloud spend. An idle resource consumes energy and generates cost, even when it contributes nothing to the workload.
GreenOps connects these signals by tracking carbon, energy, and water usage across cloud infrastructure. Teams can then evaluate environmental impact alongside cost and prioritize improvements that reduce both.
GreenOps and AI: Managing a new wave of infrastructure growth
Generative artificial intelligence (AI) adds another layer of complexity to cloud infrastructure. AI workloads can require significant compute capacity, while demand often changes faster than traditional planning cycles can accommodate.
That makes it harder to understand where resources are being used efficiently. It also makes cost, energy, and carbon visibility more important.
GreenOps helps teams evaluate AI infrastructure alongside the rest of their cloud environment. They can:
- Track environmental impact by workload, service, and region
- Identify idle or overprovisioned graphics processing unit capacity
- Compare energy and carbon impact across infrastructure choices
- Connect inefficient resource use with its financial cost
Tracking AI inference, not just training
AI sustainability discussions often focus on model training. Training can require intensive compute, but it represents only one part of a model’s lifecycle.
Inference begins once a trained model enters production. It occurs whenever:
- A chatbot generates a response
- A recommendation system serves a result
- A translation service processes a request
Unlike a defined training run, inference continues as long as the application remains active. Its total impact therefore depends on traffic, model choice, infrastructure efficiency, and resource utilization over time.
Idle or oversized graphics processing unit capacity can increase both cloud spend and environmental impact. GreenOps makes that relationship easier to examine by placing carbon, energy, and cost signals within the same operational view.
With that visibility, teams can identify where provisioned capacity exceeds demand and prioritize changes that improve both financial and environmental efficiency.
What makes GreenOps hard to adopt in practice
GreenOps can be difficult to adopt, even when its value is clear. Sustainability data is often fragmented, attribution depends on incomplete tagging, and ownership spans several teams.
These challenges make GreenOps easier to deprioritize when engineering teams are also managing incidents, releases, and cost controls.
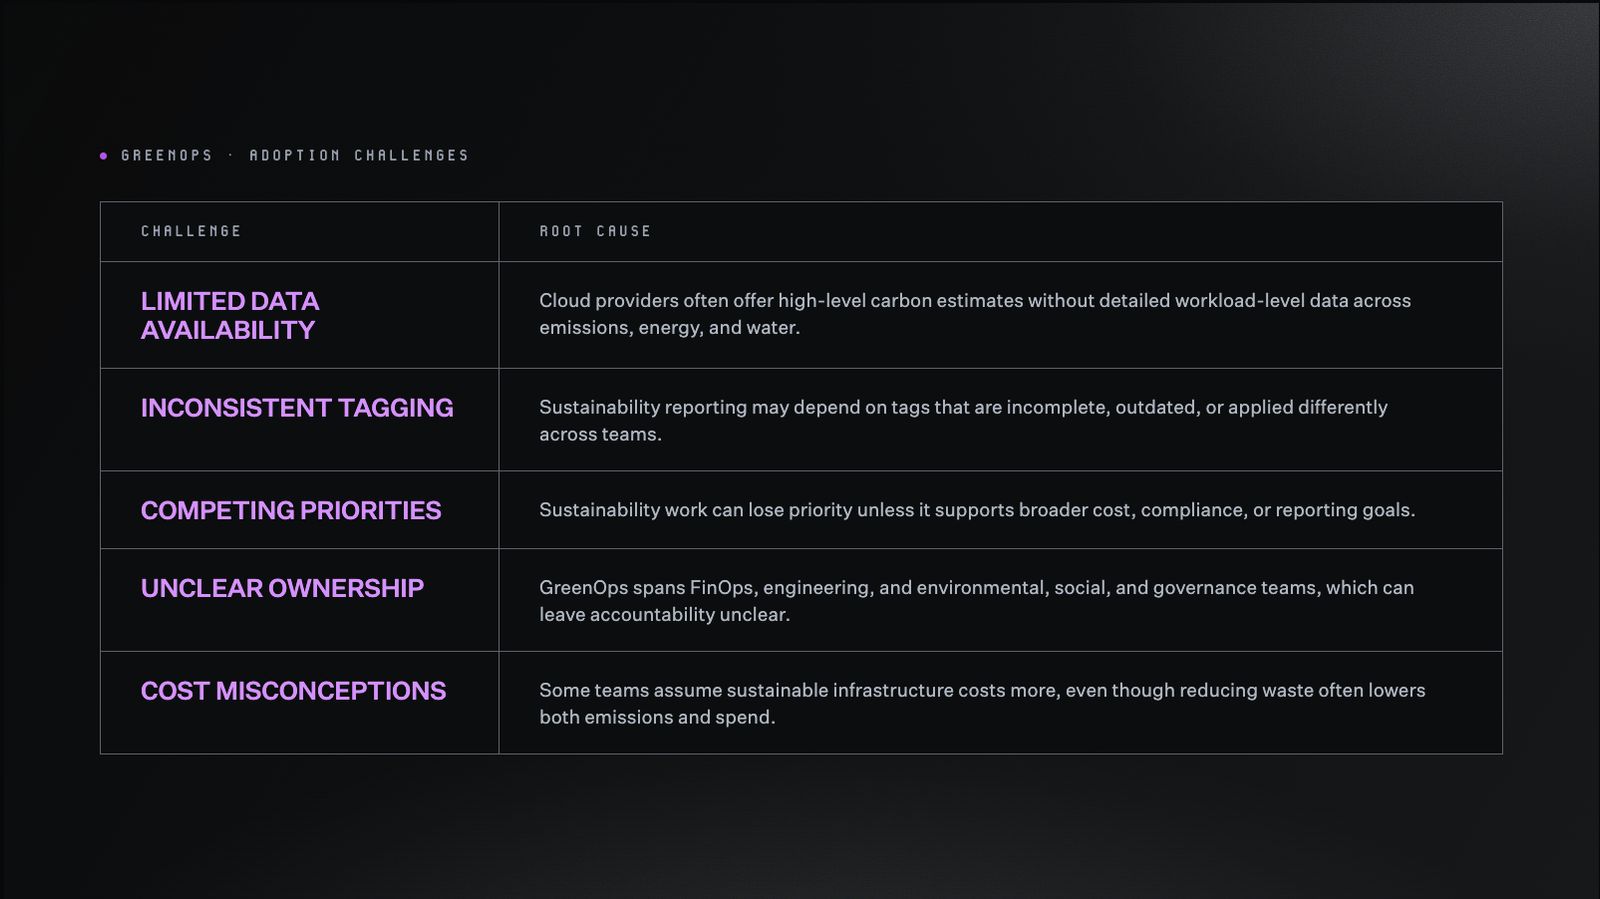
Understanding where adoption friction comes from is the first step toward removing it.
These barriers become easier to address when sustainability data appears alongside cost data. Using the same dashboards, owners, and workflows helps teams act without creating a separate operating model.
GreenOps implementation: Where to start and what to expect
GreenOps does not require a separate workstream or a lengthy rollout. The most practical approach is to add sustainability metrics to the infrastructure workflows your team already uses.
This approach grounds adoption in familiar decisions, including rightsizing, resource cleanup, cost allocation, and reporting.
Step 1: Use cost to identify likely impact
Perfect emissions data is not required to begin. In many environments, expensive compute resources are also significant sources of energy use and emissions.
Cost data can therefore provide a useful starting point. It helps teams identify where infrastructure consumption is concentrated before completing a broader sustainability assessment.
This approach does not replace environmental measurement. It narrows the first set of workloads worth investigating.
Step 2: Choose tooling that does not depend on perfect tags
Tagging can improve attribution, but it should not determine whether measurement is possible. Tag coverage is often incomplete, inconsistent, or difficult to maintain across large environments.
Look for tools that estimate impact using signals such as:
- Instance type
- Region
- Service
- Usage data
North’s GreenOps uses these signals to track carbon emissions, water consumption, and energy usage without requiring tagging or configuration first.
Teams can still improve attribution over time. Our guide to cloud tagging explains how to build a stronger tagging foundation.
Step 3: Prioritize cost and carbon wins together
Start with changes that reduce resource waste and cloud spend simultaneously. These initiatives are easier to support across engineering, finance, and sustainability teams.
- Shut down idle resources: Unused infrastructure continues consuming energy and generating costs.
- Rightsize overprovisioned compute: Better alignment between capacity and demand reduces waste without compromising performance.
- Consolidate redundant deployments: Removing unnecessary duplication reduces infrastructure consumption across environments.
Our guide to cloud overprovisioning covers the practical steps for rightsizing excess capacity.
Step 4: Layer GreenOps into your existing FinOps workflows
Teams with an established FinOps practice already have much of the required operating model. Cost allocation, reporting, and anomaly workflows can also support sustainability tracking.
In practice, teams can:
- Add emissions data to existing FinOps dashboards
- Review impact by team, service, workload, or environment
- Route sustainability anomalies through established alert channels
- Include environmental metrics in regular infrastructure reviews
This approach avoids creating another toolchain or meeting cadence. GreenOps becomes an additional layer within the workflows already guiding cloud decisions.
Step 5: Start with the metrics that give the clearest signal
A focused set of metrics makes early reporting easier to interpret. GreenOps teams should begin with the environmental signals most directly connected to cloud infrastructure:
- Carbon emissions: The estimated greenhouse gas impact of each workload
- Energy consumption: The power required to operate supporting infrastructure
- Water consumption: The water used to support data center operations
These metrics establish a baseline across workloads, services, and regions. Teams can then add more detailed reporting as their GreenOps practice matures.
Step 6: Measure progress over time
A single snapshot cannot show whether infrastructure efficiency is improving. Establish a baseline, then review changes across consistent reporting periods.
Directional trends are often more useful than isolated totals. They show whether rightsizing, resource cleanup, or relocation decisions are reducing impact.
Making these metrics visible across engineering, FinOps, and environmental, social, and governance teams also creates shared accountability. That turns GreenOps into an ongoing operating practice rather than a one-time assessment.
What GreenOps looks like inside North
North’s GreenOps brings sustainability data into the same platform teams use to manage cloud spend. That matters because the first step toward a more sustainable cloud environment is often getting infrastructure costs under control.
Once cloud accounts are connected, GreenOps automatically tracks carbon emissions, energy consumption, and water usage. Teams can then see where consumption is concentrated, reduce avoidable waste, offset remaining emissions, and prepare reports without assembling data manually.
Keep commitment coverage aligned with usage
Cloud commitments can make teams hesitant to reduce infrastructure when usage changes. Scaling down may lower consumption, but it can also leave fixed commitments underused.
North offers two approaches that preserve month-to-month flexibility:
- Flexbot delivers commitment savings with no lock-in risk, adjusting coverage month to month as usage changes.
- Autobot is an autonomous commitment engine that buys commitments in smaller monthly increments and adjusts them over time, using machine learning to read usage patterns and projected demand so coverage scales up or down as needs change.
Both approaches help discounted coverage follow real usage more closely. Teams can scale down unnecessary infrastructure without being constrained by a rigid purchasing strategy.
GreenOps shows the sustainability impact by tracking changes in carbon, energy, water consumption, and cost.
See environmental impact across your infrastructure
GreenOps breaks down carbon emissions, energy consumption, and water usage by:
- Workload
- Region
- Service
- Resource
- Purchase type
This detail helps teams move beyond account-level estimates. They can identify which workloads and regions contribute most to their footprint and investigate the infrastructure behind them.
Identify and reduce inefficient infrastructure
Visibility is only useful when teams know what to do next. North’s Rightsize turns that data into practical recommendations for reducing unnecessary resource consumption.
Teams can see idle resources at a glance, identify oversized workloads, and understand how to implement each rightsizing change. GreenOps adds the environmental context by showing the related cost, carbon, energy, and water impact.
Together, the two tools help teams prioritize actions such as:
- Removing idle resources
- Rightsizing oversized compute
- Relocating suitable workloads
- Consolidating redundant infrastructure
These changes can improve financial and environmental efficiency at the same time.
Ask sustainability questions with Noros
The GreenOps dashboard provides the underlying data. Noros, North’s AI agent for cloud finance, makes that information easier to explore across teams.
Noros makes sustainability data accessible to anyone on the team by answering plain-language questions about carbon footprint, regional efficiency, and workload impact.
A FinOps or engineering lead can ask questions such as:
- Which workloads produced the most emissions this quarter?
- Which regions consumed the most energy?
- Where could rightsizing reduce both cost and environmental impact?
- What offset guidance applies to the current footprint?
Noros routes each question to the relevant data and returns a grounded answer. Sustainability analysis no longer depends on one person knowing where every metric lives.
Fund verified carbon offsets in the platform
Infrastructure improvements can reduce emissions, but they may not eliminate them. GreenOps lets teams purchase verified carbon credits directly through the dashboard for the remaining footprint.
Teams can also allocate a percentage of savings generated through Coverage toward carbon offsets. This connects cloud cost optimization with broader sustainability goals.
North handles the transaction and provides documentation and certified receipts for each purchase.
Prepare sustainability reports without rebuilding the data
GreenOps keeps sustainability data organized and available for reporting. Teams can export:
- Environmental impact reports
- Verified offset receipts
- Carbon-neutrality certificates
Finance, ESG, and leadership teams can work from the same record. That removes the need for a separate data collection exercise before each board meeting, audit, or reporting cycle.
GreenOps and FinOps: Stronger together with North
FinOps gave teams a shared framework for managing cloud costs. GreenOps extends that framework by adding carbon, energy, and water data to the same infrastructure view.
The idle and overprovisioned resources driving cloud waste also consume energy, generate emissions, and draw water in physical data centers.
When teams reduce that waste, cost and environmental impact often decline together.
Teams already tracking cost and performance have the foundation to begin. They can use the same workflows to measure impact, prioritize improvements, and report progress over time.
Explore our free tier to see where cost and sustainability opportunities overlap across your cloud environment.
FAQs
Answers to common questions about the product or feature covered in this post.
What is GreenOps?
GreenOps is the practice of measuring and reducing cloud infrastructure’s environmental impact alongside cost. It covers carbon emissions, energy consumption, and water usage across cloud workloads.
GreenOps makes these signals visible within existing infrastructure workflows. Teams can identify waste, prioritize improvements, and report progress without creating a separate sustainability practice.
What is the difference between GreenOps and FinOps?
FinOps focuses on cloud cost visibility, allocation, and optimization. GreenOps adds carbon, energy, and water data to the same operational framework.
The two practices often address the same infrastructure inefficiencies. Idle resources and oversized workloads increase both cloud spend and environmental impact. GreenOps extends FinOps rather than replacing it.
Can GreenOps reduce emissions or only track them?
GreenOps supports both measurement and reduction. It shows which workloads, resources, and regions contribute most to your environmental footprint.
Teams can use that visibility to identify opportunities such as:
- Removing idle resources
- Rightsizing overprovisioned compute
- Consolidating redundant deployments
- Relocating suitable workloads
These changes can reduce emissions, energy consumption, water usage, and cloud costs together.
What is the difference between GreenOps and carbon offsetting?
GreenOps is the broader practice of measuring and reducing cloud infrastructure’s environmental impact. Carbon offsetting compensates for emissions that remain after reduction efforts.
The process should begin with visibility and infrastructure efficiency. Verified offsets can then address the remaining footprint.
Does GreenOps require changes to existing infrastructure?
No. GreenOps analyzes existing cloud usage, resource, service, and regional data. Teams can begin measuring their footprint without changing how infrastructure is provisioned.
North’s GreenOps also works without requiring a complete tagging strategy or a separate configuration process. The system uses infrastructure signals such as resource type, service, region, and usage data.
Once cloud accounts are connected, teams can review carbon emissions, energy consumption, and water usage without completing a tagging project first.
How does North make GreenOps easier for engineering and FinOps teams?
North places carbon, energy, and water data alongside the cloud cost information teams already review. Teams can analyze environmental impact by workload, region, service, and resource.
Noros, North’s AI agent for cloud finance, makes that data accessible through plain-language questions about carbon footprint, regional efficiency, and offset guidance.
Teams can also identify high-impact infrastructure, purchase verified offsets, and export organized sustainability data without running a separate collection process.
What data does North’s GreenOps track?
North’s GreenOps tracks carbon emissions, energy consumption, and water usage across cloud infrastructure. Teams can review impact by workload, region, service, resource, and purchase type to identify where environmental consumption is concentrated.
Can North purchase carbon credits for us?
Yes. Teams can purchase verified carbon credits directly through the GreenOps dashboard. North handles the transaction and provides documentation and certified receipts.
Teams can also allocate a percentage of savings generated through Coverage toward their offset efforts.
Can GreenOps data support ESG reporting?
Yes. North’s GreenOps organizes sustainability data for environmental, social, and governance reporting. Teams can export impact reports, verified offset receipts, and carbon-neutrality certificates from the dashboard.
This gives finance, environmental, social, and governance teams and company leadership a shared record without rebuilding the data before each reporting cycle.