Coststreams updates: Navigate faster, dive deeper
We ship improvements to Coststreams continuously. This post brings together everything we've added recently, all focused on making it easier to understand, explore, and act on cloud cost allocation.
.png)
Coststreams is where teams in North break down and understand cloud spend across business units, teams, and projects. As environments grow, cost allocation naturally becomes more complex. This update is focused on clarity, speed, and flexibility, without losing the depth needed by engineering, DevOps, and finance teams.
With this release, you get:
- A cleaner, faster overall experience
- New ways to visualize how costs flow
- A finance-friendly table view
- More control over how you split, filter, and explore data
- Custom business metrics tied to your cloud spend
- Collaboration and sharing tools built in
Whether you are an engineer digging into spend drivers or a finance leader reporting on allocation, Coststreams now adapts to how you work.
A streamlined interface with improved usability
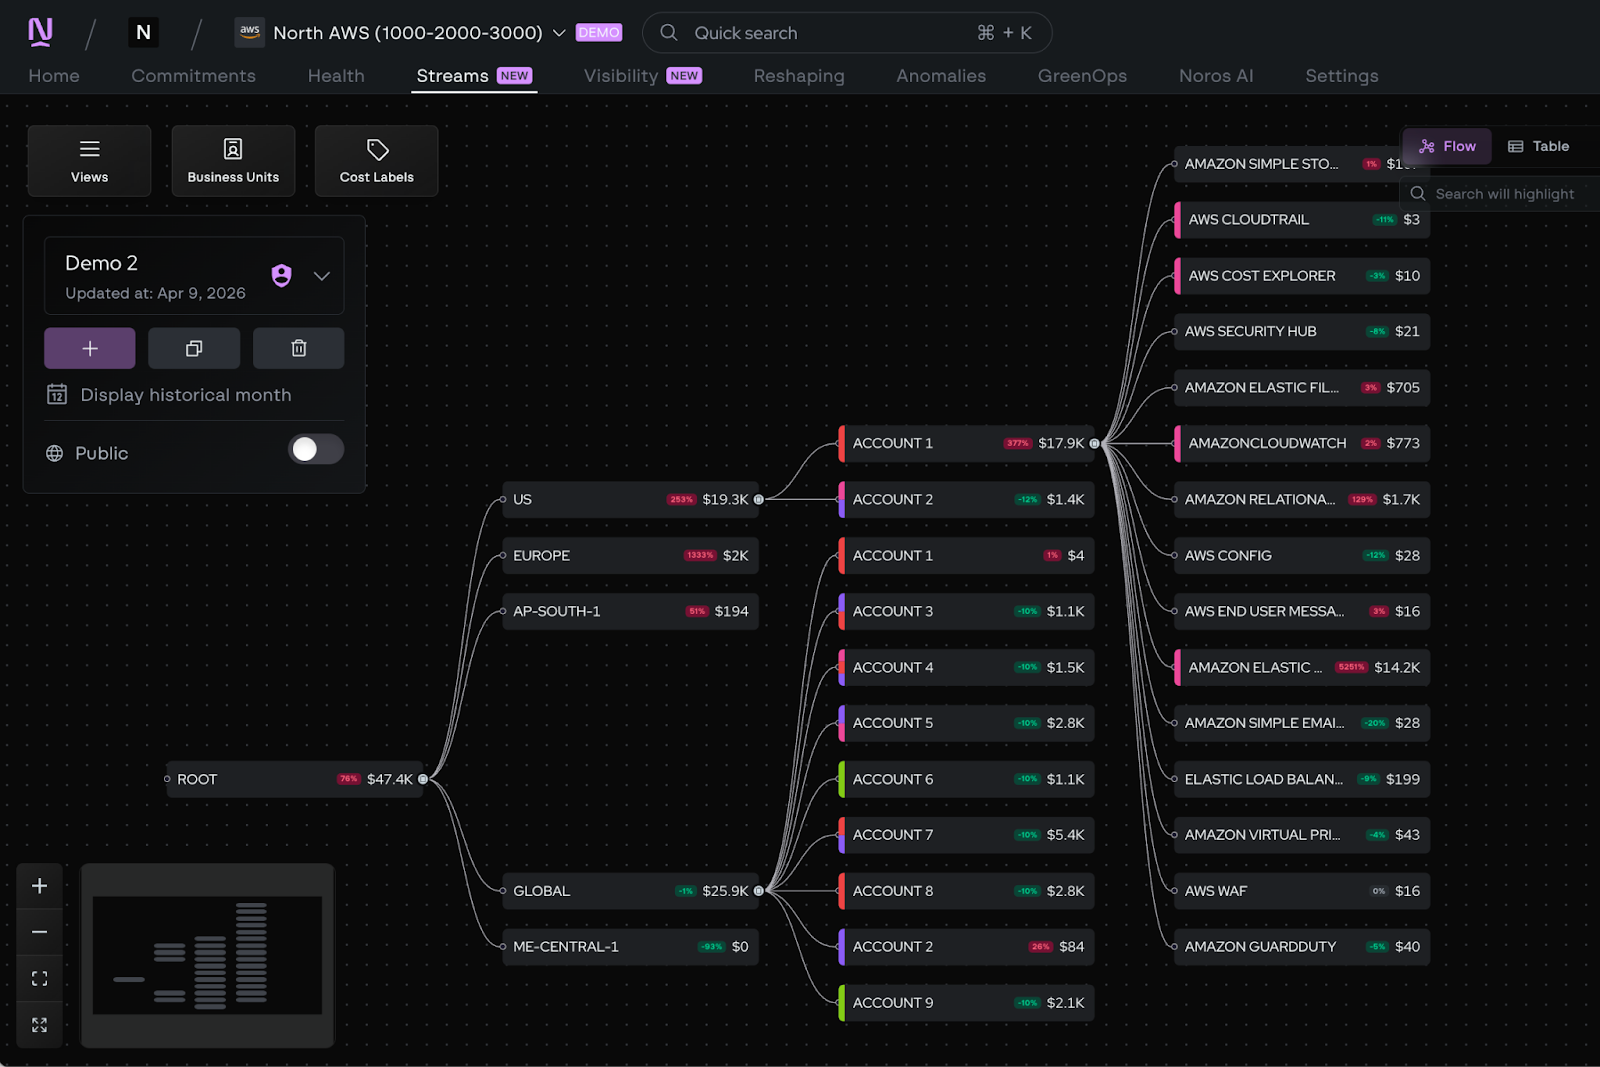
We redesigned the core Coststreams experience to make it calmer and more responsive in real-world environments. In the “Streams” tab of the app, you’ll notice faster load times, smoother navigation, and cleaner, less crowded components.
Complex streams are now easier to read and interact with. We modularized the interface, refined the visual hierarchy, and optimized navigation so you can zoom, move, and explore without friction.
Common actions are also faster. Applying cost labels, reviewing analytics, and checking budget summaries now take fewer steps and feel more direct.
New ways to explore your cost allocation
Coststreams now gives you multiple ways to explore the same underlying allocation data, so different teams can work in the format that makes the most sense to them. Whether you prefer a visual overview or a structured, spreadsheet-style analysis, you can move between views without changing the underlying logic.
Visualize cost allocation with Cost Flow
Cost Flow introduces a Sankey-style visualization that shows how cloud spend moves through your streams. Each flow represents a portion of cost, with width directly corresponding to spend. You can pan across the diagram, zoom in and out, and hover over nodes or paths to inspect detailed cost information. Additionally, you can select groupings of costs and create their own Sankey diagram.
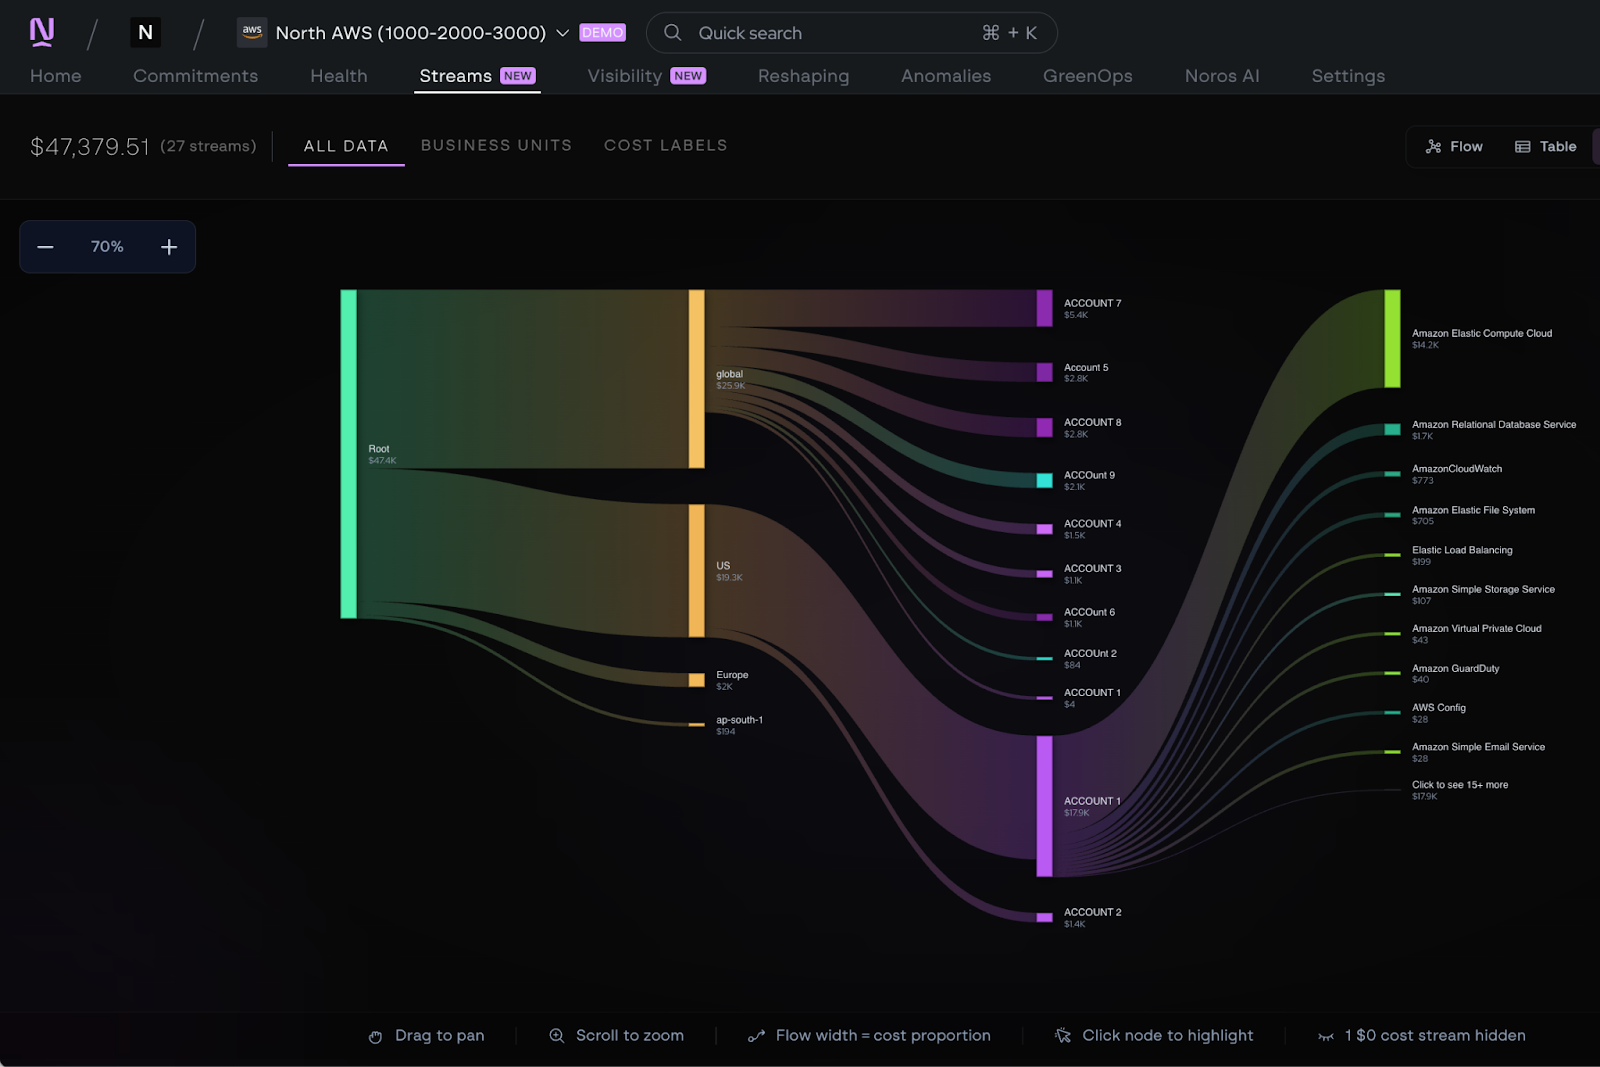
This view is especially useful for quickly understanding where costs concentrate, how they branch across teams or services, and which paths have the biggest financial impact. It’s designed to give you an immediate sense of the shape of your cloud spend and highlight the areas worth investigating further.
Analyze cloud cost allocation with Table View
Once you’ve identified a stream or cost path that needs deeper analysis, Table View lets you drill in.
Table View presents the same Coststreams data in a structured, spreadsheet-style format that many finance and engineering teams already rely on. Streams are organized in a parent and child hierarchy, allowing you to expand and collapse rows as you move between high-level rollups and detailed allocations.
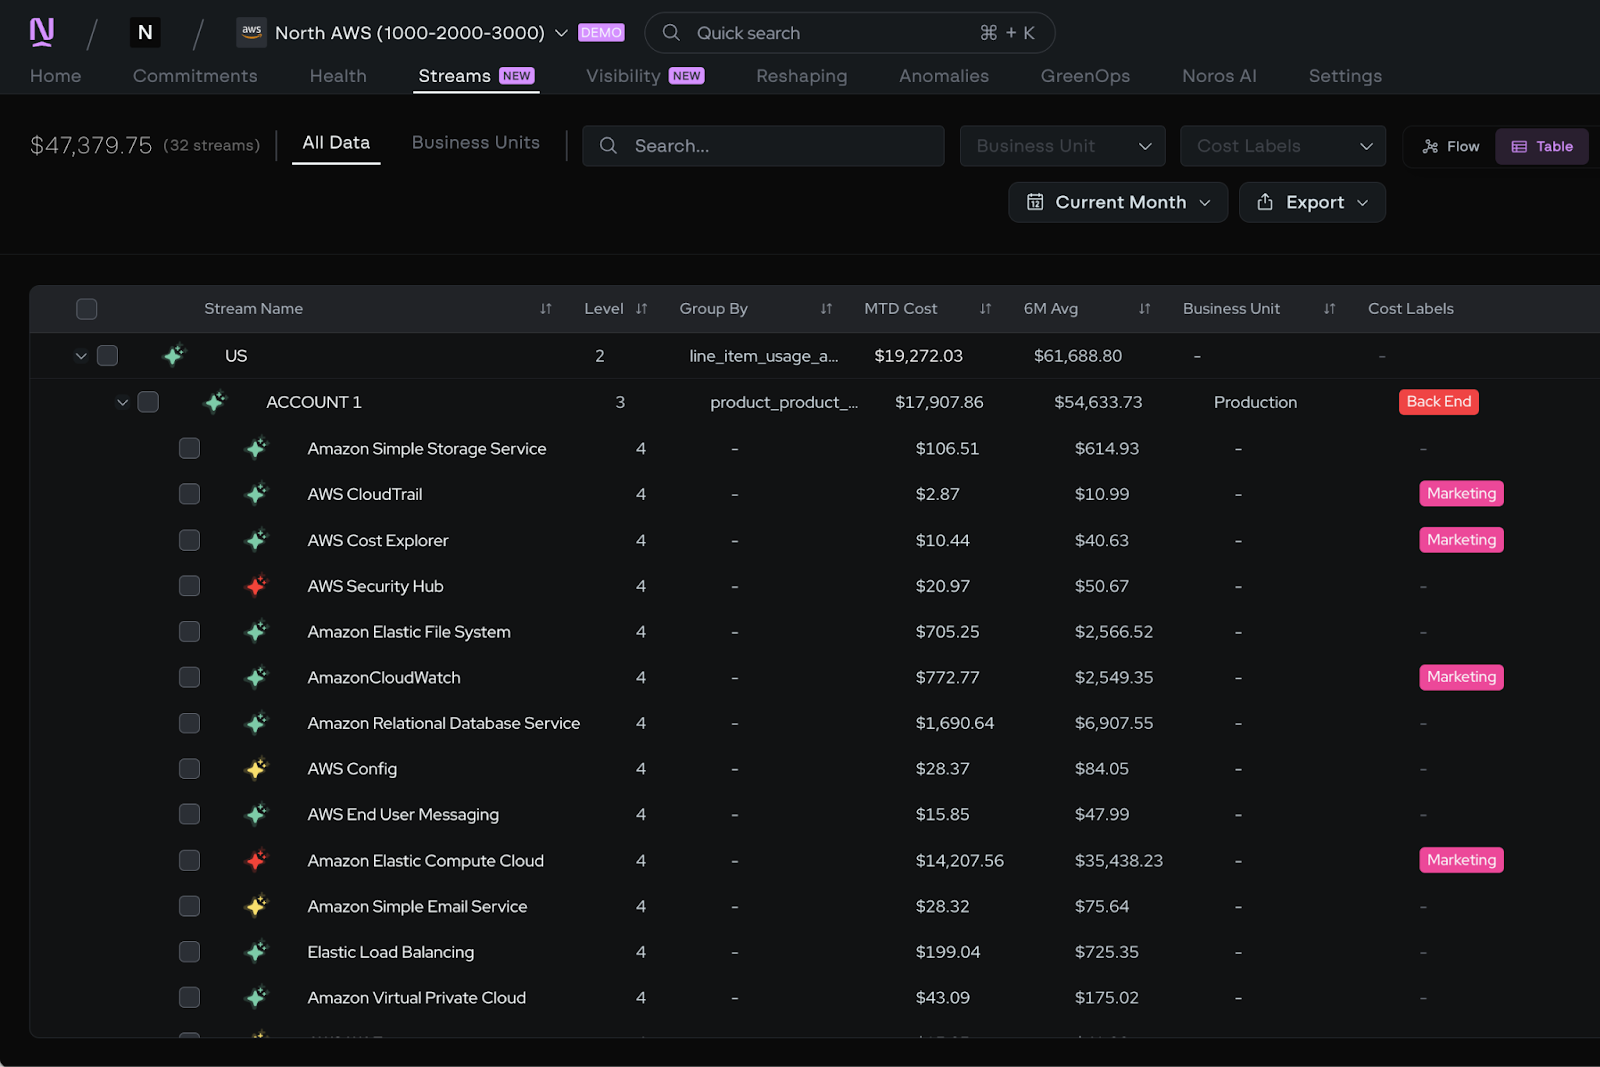
Within the table, you can analyze built-in financial metrics such as month-to-date spend, month-over-month change, and six-month averages. You can also move between historical periods and export the table for reporting or further analysis outside the platform.
This view is ideal for anyone who prefers working in rows and columns and needs a clear, auditable way to review cost allocation over time.
More depth when you need it
Beyond new views, we expanded what you can do inside Coststreams.
More fields to split and filter by
Coststreams now supports close to a hundred of additional dimensions. This includes tags, product identity, technical specifications, environments, accounts, and more.
Different personas can now build views that match how they think:
- Finance teams can group spend by department or account.
- Engineering teams can drill into product families or machine types.
- Platform teams can isolate environment-level drivers.
And navigating all of it is faster too. Filters load lazily so performance stays smooth even in large environments, and tree-select navigation lets you drill down quickly without losing your place.
Exclude for simpler filtering
Sometimes you want to exclude part of your spend to narrow down.
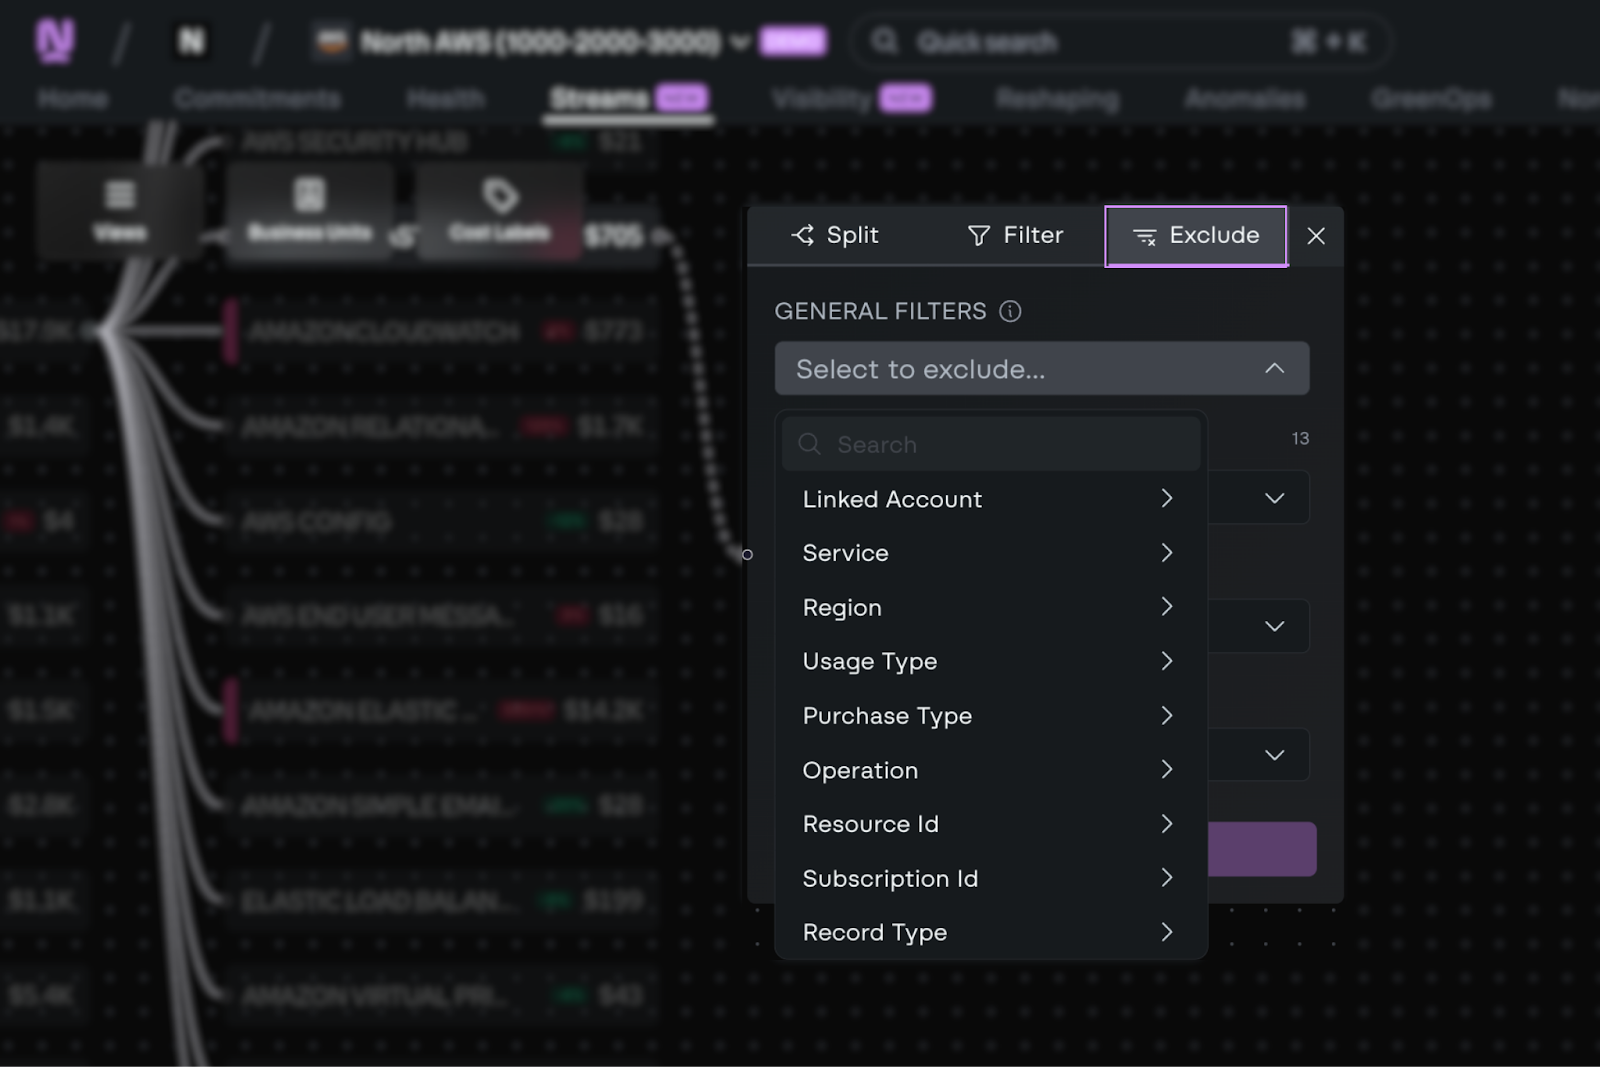
Exclude acts as an inverse filter, letting you remove a specific service or attribute without rebuilding your entire view. This makes it easier to iterate quickly while keeping allocation logic intact.
Weekly granularity for faster feedback
Coststreams previously operated at monthly granularity. Now teams can view cost allocation at a daily level in both Cost Flow and Table View, so you don't have to wait until month-end to see if a change had an impact.
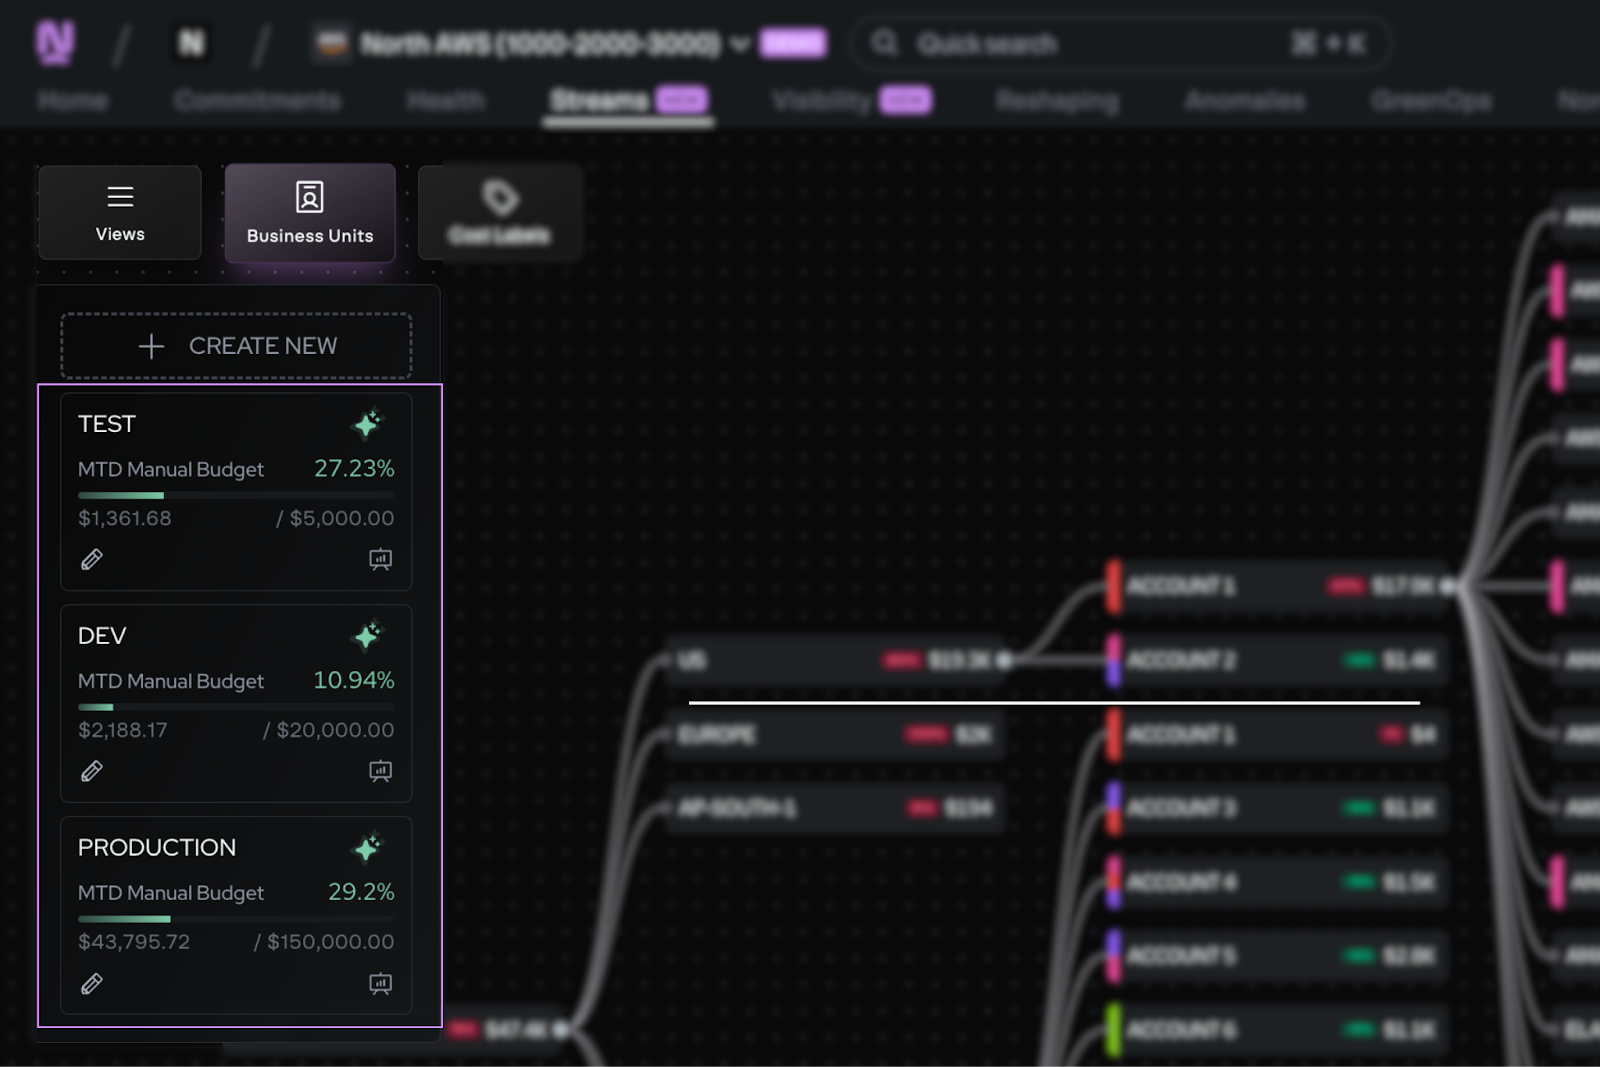
Custom business metrics with Cost Units
Raw cloud cost data only tells part of the story. Cost Units lets teams define and track their own cost efficiency metrics, like cost-per-click, cost-per-customer, or cost-per-deployment, directly inside Coststreams. You define the metric, decide the granularity, and choose how it maps to your business units.
Reporting and collaboration, built in
Cost allocation doesn't stop at analysis. This release adds a set of collaboration and sharing features that make it easier to get Coststreams data in front of the right people, in the right format, without extra steps.
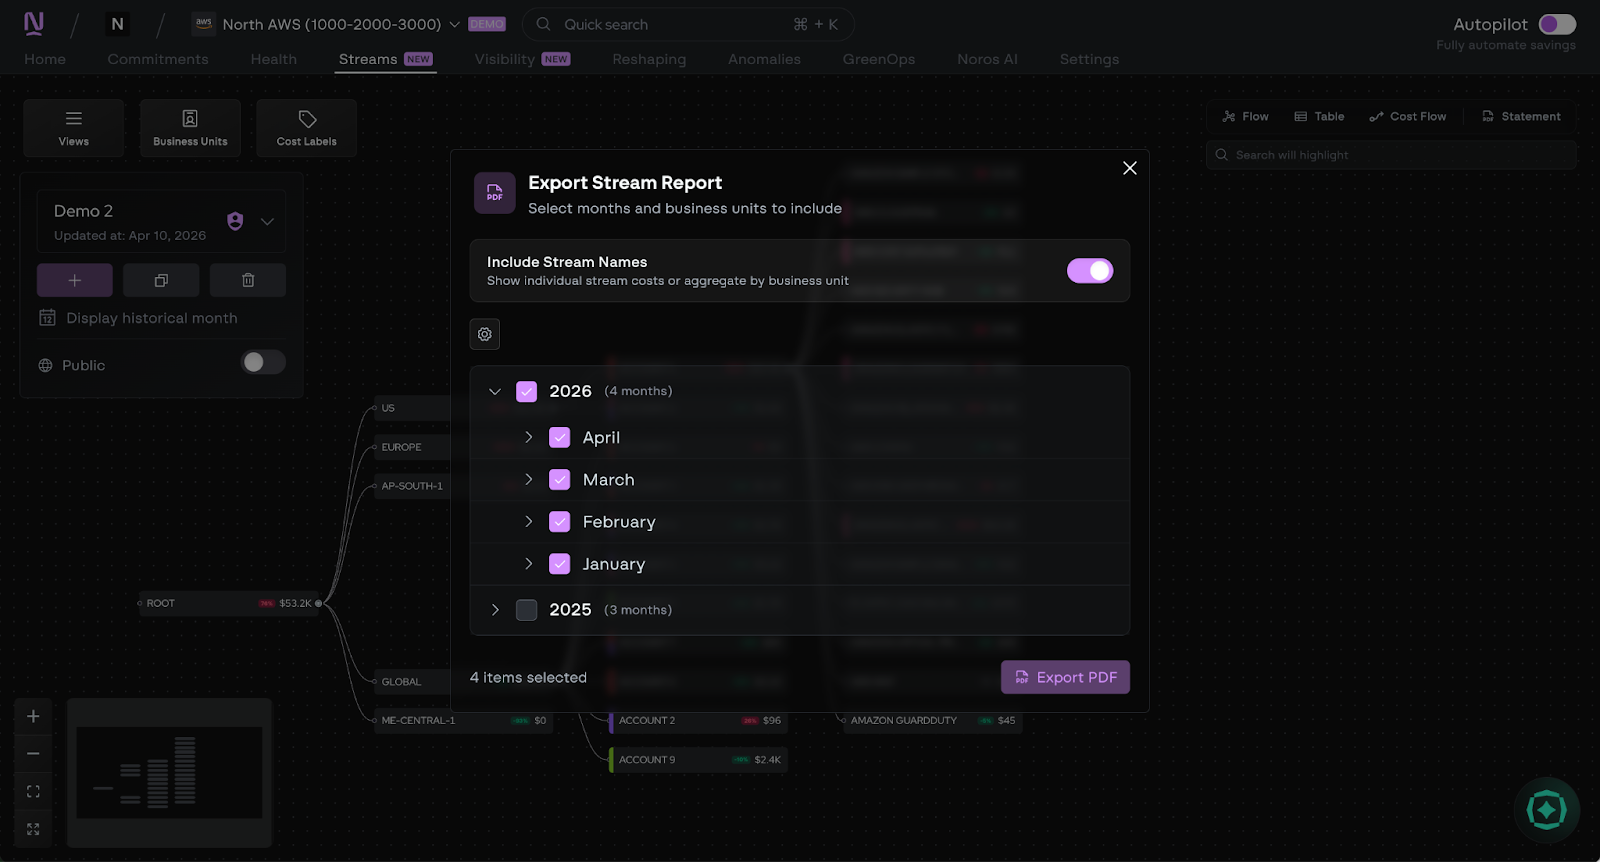
- Monthly statements and PDF reports: Generate polished PDF reports directly from Coststreams, including monthly statements and showback reports. Then, share them with stakeholders.
- Public API and API key management: Access data programmatically and pipe it into internal dashboards, BI tools, or automated workflows.
- Endpoint notifications: Set up alerts so your team gets proactive email notifications when costs shift significantly, without having to manually check dashboards.
- Deep-linkable views: Every Coststreams view is now shareable via URL. Drop a link in Slack or an email and the recipient lands exactly where you were, accessing it with their North account.
Get started with Coststreams
Cost allocation only works if people can actually understand it and use it. Coststreams is built to turn raw cloud billing data into views teams can trust, whether that’s a high-level look at how spend flows or a detailed breakdown you can analyze line by line.
With these updates, it's easier than ever to move from insight to action, without pulling data, building pipelines, or maintaining spreadsheets.
Jump into the “Streams” tab in the app to explore Cost Flow and Table View, or ask Agent North to help you investigate a specific question. Visit our documentation to learn more, and start building cost views that reflect how your business really runs.

Book a demo
Get started in as little as 5 minutes with no long-term contracts or lock-ins. Pay month-to-month and stay flexible.


Make your cloud work smarter today
Get started in as little as 5 minutes with no long-term contracts or lock-ins. Pay month-to-month and stay flexible.


