Introducing enhanced visibility in North: Explore, compare, and forecast
Explore cloud costs with hourly granularity, compare changes over time, and forecast spend using ML—without exporting data or rebuilding views.
Today we’re launching enhanced visibility in North, a connected way to explore, compare, and forecast cloud costs in one workflow.
With an improved Explore module, a streamlined Compare workflow, and Forecast, teams can move from analysis to planning without exporting data or rebuilding context in spreadsheets.
This update is designed for engineering, DevOps, and finance teams who need deeper data context and the ability for AI to analyze and predict spend.
A single workflow for understanding cost behavior
With this release, Visibility becomes a connected workflow. You can explore your cloud costs, compare different configurations or time ranges, and forecast future spend using the same filters and groupings throughout.
That continuity matters. It reduces setup time, removes ambiguity, and makes insights easier to trust.
Explore: Introducing hourly cost granularity
Explore remains the default entry point in the Visibility tab. It’s where you slice and group cost data to understand what’s happening right now.

You can analyze spend by service, account, region, usage type, and more, with support for daily, monthly, and now hourly granularity. Hourly views make it possible to spot short-lived spikes or sudden changes that would otherwise get lost in daily rollups.
Explore is intentionally flexible. It’s designed to answer open-ended questions and help you find the patterns worth investigating further.
*NEW* Compare: Understand what changed and why
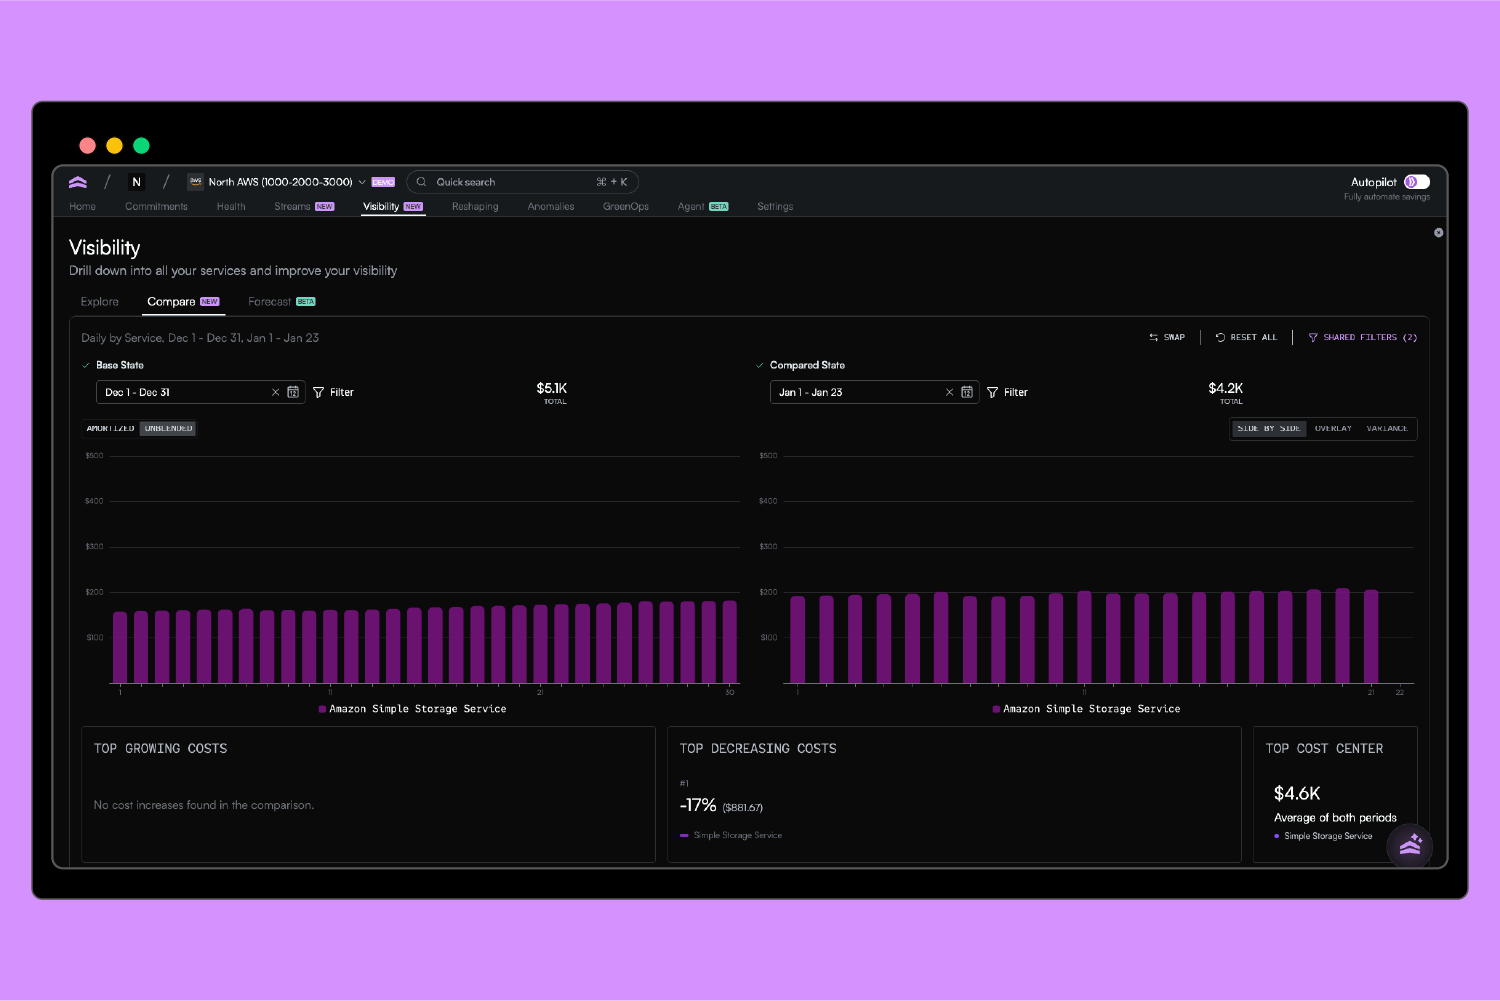
Once you’ve explored your data, Compare helps you answer the next question: what’s different?
The Compare tab lets you evaluate two datasets side by side, whether that’s this month versus last month, the same period last year, or two entirely different configurations.
You can overlay results to visualize shifts over time or switch to variance views to see exactly where increases and decreases occurred.
We’ve also refined the Compare interface to make it easier to work with larger datasets. Totals are now clearly visible for each comparison window, overlays are easier to read, and interactions remain stable as you swap views or adjust parameters.
*NEW* Forecast: Plan with confidence, not guesses
Forecasting is often treated as a static estimate or a simple moving average. The new trend forecaster in North goes deeper.
Forecast uses a machine learning(ML) model to generate probabilistic forecasts based on the exact dataset you choose. Instead of forecasting total spend in the abstract, you can forecast specific services, accounts, or filtered views using a configurable look back period.
That means you can answer questions like:
- What happens if we project the last 60 days forward?
- How does this look with a longer historical baseline?
- What’s the likely range of outcomes, not just a single number?
Forecasts include an average projection along with minimum and maximum bounds, helping teams understand uncertainty and risk. You can view forecasts alongside actual spend and explore the data in both chart and table formats.
This makes the trend forecaster useful for monthly check-ins, quarterly planning, yearly budgeting, and more granular scenario analysis.
Over time, forecasting capabilities will also be integrated into Streams and other areas of the platform.
Shared filters across Explore, Compare, and Forecast
One of the most requested improvements was the ability to keep context as you move between views.
Filters can now be shared across Explore, Compare, and Forecast so you don’t need to reapply the same setup every time you switch tabs. If you want to experiment, you can also unsync filters and compare different configurations side by side.
This makes it easier to maintain consistency when analyzing changes, while still giving you flexibility when you need it.
Designed for teams who build and manage cloud infrastructure
These updates are built around how real teams actually work.
Engineering and DevOps teams can explore cost behavior at a granular level, compare changes after deployments or infrastructure shifts, and export scoped datasets directly from the Explore tab to share or analyze further.
Finance teams can use the same views to understand month-over-month changes, validate assumptions, and export forecasts from the Forecast tab for planning, reporting, and reviews.
Because everything lives in one platform, teams can explore, compare, and export without pulling data into separate tools or rebuilding context in spreadsheets.
Get started with enhanced visibility
Head to the Visibility tab in the app to start exploring, comparing, and forecasting your cloud spend. You can carry filters across views, adjust scenarios in real time, and use Agent North to help investigate specific questions as they come up.
This is the foundation for a more connected, proactive way to manage cloud costs, and we’re just getting started.

Related article
.png)
Book a demo
Get started in as little as 5 minutes with no long-term contracts or lock-ins. Pay month-to-month and stay flexible.


Make your cloud work smarter today
Get started in as little as 5 minutes with no long-term contracts or lock-ins. Pay month-to-month and stay flexible.


