Cloud resource management: A three-layer guide
A practical guide to the three layers of cloud resource management (rate optimization, cost optimization, and visibility): what each one covers, why they get tangled together, and how to get all three working in your environment.
Imagine inheriting a massive mansion from owners you never met. The lights have been on for years, the heat is running in empty wings, and the water bill keeps arriving for pipes you can't even locate.
The house is costing you money you didn't budget for, and you have no idea where to start.
That's what managing cloud resources feels like for most teams. Resources pile up, bills balloon, and suddenly nobody can answer the most basic question: what are we paying for, and why?
Cloud resource management is how you get that answer, and more importantly, how you act on it. In this guide, we'll break down what it really looks like in practice and how to get it under control at any stage of the journey.
What is cloud resource management?
Cloud resource management is the process of overseeing, allocating, and optimizing the infrastructure and services your organization runs in the cloud. That includes:
- Compute: the machines running your workloads
- Storage: where your data lives
- Networking: how it all connects
- Third-party services plugged into your environment
The goal is to ensure everything is performing efficiently, being used appropriately, and costing only what it should.
It’s not just about cutting costs
When people hear "cloud resource management," the instinct is to think about cost reduction, and while cost is a big part of it, the picture is broader than that. When you manage your cloud resources well, you also get:
- Stability: you know where your spend is going and how it flows
- Early warning: you can spot spikes before they snowball
- Predictability: you can plan ahead instead of reacting at month-end
- Confident decisions: you understand the infrastructure you're making decisions about
The difference is between knowing your house has a leak and knowing exactly which pipe, in which room, and how much water you're losing every day.
Who owns it: engineering, finance, or both?
Cloud resource management sits at the intersection of engineering and finance, which is what makes ownership tricky. Engineers understand the infrastructure but aren't always focused on the financial side, while finance understands the budget but can't always interpret the bill.
The teams that do this well treat effective cloud resource management as a shared language rather than a siloed responsibility: one control tower, one source of truth, with both sides working from the same data.
Once ownership is settled, the work itself splits into three categories.
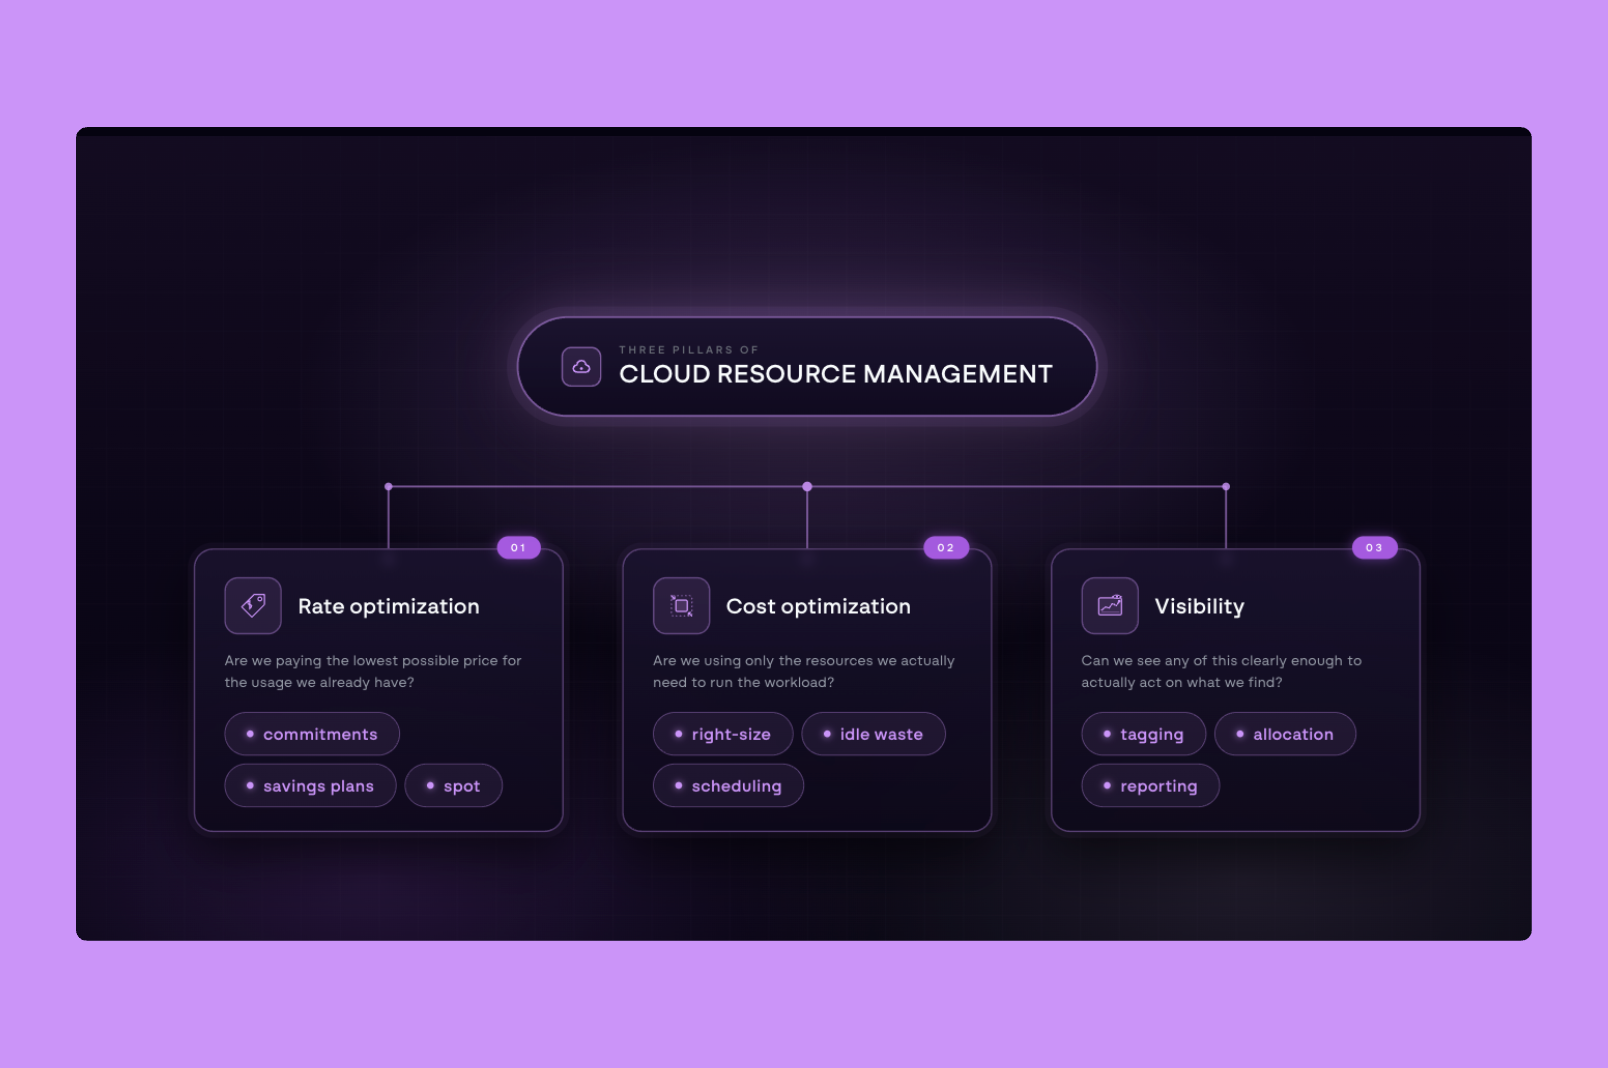
The three layers
Most cloud cost conversations get tangled because people use "optimization" to mean three very different things, and pulling them apart makes the work much clearer.
The three layers are rate optimization, cost optimization, and visibility, and each asks a fundamentally different question.

Each one is a different problem with a different solution, and most teams are only working on one or two of them at a time.
Layer 1: Rate optimization
Every major cloud provider charges different prices for the same resource: a flexible on-demand rate, and a discounted rate for teams willing to commit to a certain level of usage over time. The gap between the two is significant, and capturing it is the single fastest cost lever available in most environments.

Each provider has its own version of this:
- Amazon Web Services (AWS) offers Savings Plans and Reserved Instances, with discounts up to 72% off on-demand pricing for one- or three-year commitments
- Google Cloud Provider (GCP) offers Committed Use Discounts (CUDs), with discounts up to 70% for three-year commitments on resource-based or spend-based terms
- Microsoft Azure offers Reservations and Savings Plans, with discounts up to 65% for one- or three-year commitments across compute, databases, and storage
Each program has its own quirks worth understanding. For a deeper look, read our guide to Google Cloud's multi-price CUD changes.
Most teams know these exist, and most teams still default to on-demand pricing anyway. The reason is that traditional commitments lock you in: you sign up for three years of a specific instance type, your infrastructure shifts or your business priorities move, and suddenly you're paying for capacity you no longer need.
The math works on paper, but the risk doesn't, so teams pay full price (the most expensive option available) because at least it stays flexible.
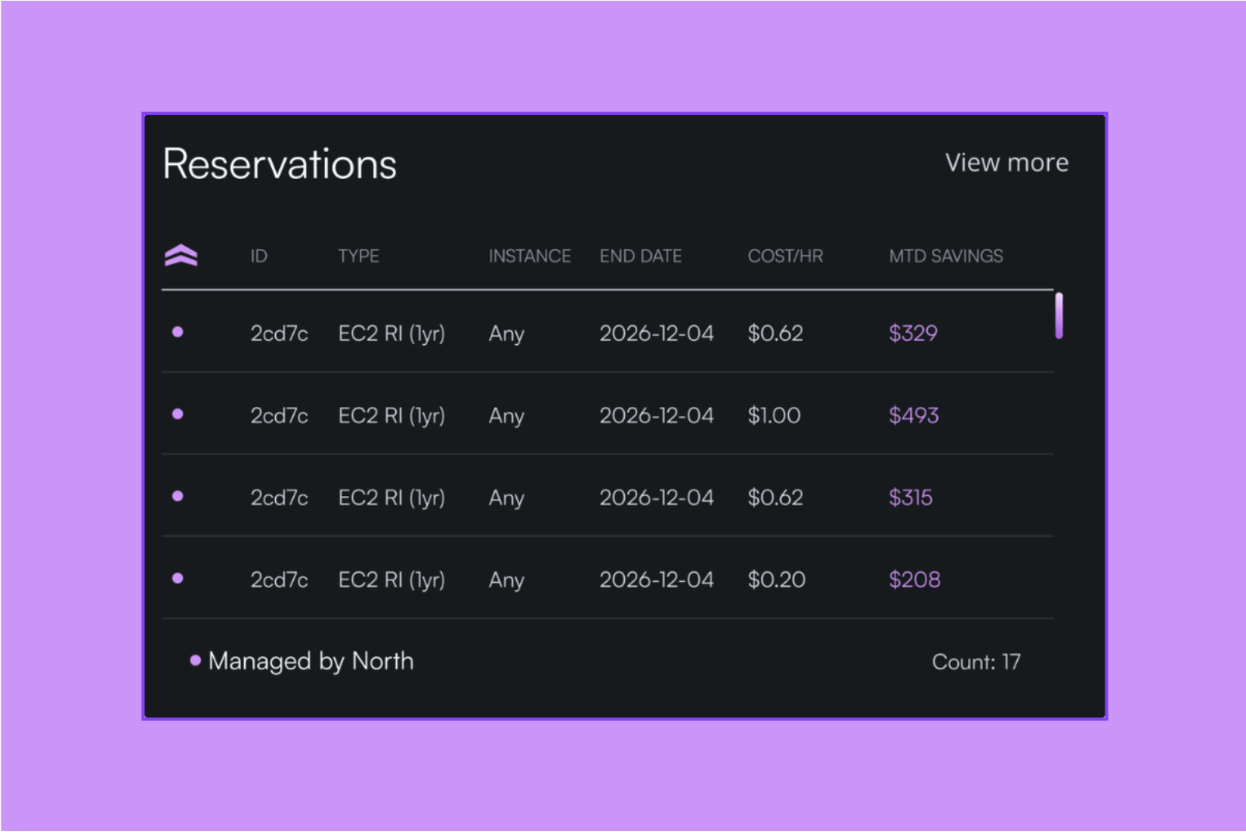
The risk isn't really the commitments themselves; it's the manual, all-or-nothing way they've traditionally been managed. Tools that continuously monitor usage and rebalance commitments in real time, such as North’s Arctic, make it possible to capture the discount without locking into a contract that may not fit a year from now.
Layer 2: Cost optimization
Every cloud environment starts with provisioning, the process of allocating resources to support a workload, and the challenge is that those decisions compound over time.
Coming back to the mansion analogy, after a few years of growth, here's what most cloud infrastructure looks like:
- Lights on, nobody home: Resources still running for projects that have long since ended.
- A twin bed in the master suite: Small workloads occupying oversized instances.
- A king-size bed in the broom closet: Undersized resources causing performance issues.
- Locked rooms nobody opens: Services running in the background that nobody remembers turning on.
The person managing the environment today probably didn't build it, and they have no easy way to know what's necessary and what's just left over.
Cost optimization is the work of going room by room to right-size what's oversized, scale up what's strained, and turn off what nobody's using. Done well, it's not a one-time cleanup but an ongoing read on which resources match the workloads they're attached to.
Layer 3: Visibility
A single cloud bill from a single provider is already difficult to understand, for various reasons:
- Resources have dependencies, so one service's cost directly affects another
- Discounts and adjustments are applied mid-month or end-of-month, making real-time tracking hard
- Line items often have no clear identifier and require deep platform knowledge to interpret
Now multiply that across AWS, GCP, Azure, Snowflake, and any other providers your team is running. Each has its own billing logic, its own data format, and its own quirks. Even something as foundational as tagging works differently across providers:
- Naming conventions vary from one platform to the next
- Enforcement mechanisms that exist on AWS may not exist on GCP or Azure
- A tagging strategy built for one provider rarely translates cleanly to another
Without a way to normalize all of that data, comparing costs across providers is like trying to read the same book in four different languages simultaneously.
Normalization means bringing everything into a single framework where the same field means the same thing regardless of where it came from, giving both engineering and finance a shared view they can work from.
Best practices for cloud resource management
The framework above describes what cloud resource management involves. The practices below are how teams keep it running in a real environment.
Good cloud computing management advice tends to follow a familiar pattern: tag everything, rightsize your instances, set up alerts. That guidance is not wrong, but it is incomplete. Getting it right is less about following a checklist and more about building habits that scale with your infrastructure.
These are the practices that consistently move the needle, regardless of where your team is starting from.
1. Get your tagging foundation right
Picture this: your AWS bill comes in 30 percent higher than last month. The instinct is to start cutting. But cutting what exactly? Without knowing where that increase came from, any action is a guess.
Tags are labels applied to cloud resources that tell you what belongs to which team, product, environment, or customer. They are the backbone of any cost allocation strategy, and without a consistent approach, everything built on top of them becomes unreliable.
The basics matter more than most teams realize:
- Agree on a naming convention before resources get created, not after
- Apply tags at the account and resource level across every provider
- Build enforcement into your deployment process so untagged resources cannot slip through

Once that foundation is in place, you can start asking the questions that matter. Good tagging is what lets you trace a spike back to its source:
- Is it one team or spread across several?
- A specific service or a pattern across your whole environment?
- A product launch or something that quietly crept up?
The goal is not just to see your total spend but to understand the story behind it. That context is what turns a cost conversation from reactive to strategic.
For a full breakdown of how to build a tagging strategy that holds up across AWS, GCP, and Azure, read our guide: Cloud Tagging Done Right: A Guide for Modern Teams.
2. Track your spikes and dips, not just your monthly total
Reviewing cloud costs monthly is a reasonable starting point, but active monitoring is what keeps teams ahead of surprises. A spike that happens in week two can look very different by the time the bill arrives at the end of the month. Setting up continuous monitoring means your team has the context and the lead time to respond before costs compound.
Here is what that difference looks like in practice:

Teams that catch cost anomalies early have time to investigate, understand the cause, and make adjustments. The same anomaly surfaced at the end of the month becomes a much harder conversation.
3. Know when overprovisioning is intentional
Overprovisioning is usually the first thing flagged when teams start thinking seriously about cloud costs. Unused capacity costs money, the logic goes, and most optimization frameworks treat it as something to identify and eliminate.
But cloud environments aren't static, and extra capacity isn't always wasteful. Sometimes it's a deliberate choice:
- Unpredictable workloads: Stability matters more than savings
- High-stakes services: The cost of underperformance outweighs the cost of excess
- Production environments: Higher buffers are required compared to dev or test
The work isn't to eliminate overprovisioning across the board; it's to tell the difference between intentional buffer and accidental waste.
Good tooling lets you set your own thresholds (by account, region, or service) so the system understands the difference too, and stops flagging deliberate choices as problems to fix. This is part of what North's Coststreams was built to do, making the breakdown between intentional and accidental waste visible without requiring exhaustive tagging coverage first.
For a closer look at what overprovisioning actually means, when to leave it alone, and how to rightsize without creating new risks, read our guide on intentional overprovisioning.
4. Plan for where you're going, not just where you are
Even teams that achieve good visibility often struggle with the next step: understanding how costs are changing over time and where they are headed. The default approach is manual, which means pulling a report for this month, pulling one for last month, and putting them in a spreadsheet. It works, but it's slow, error-prone, and tells you what happened rather than why or what comes next.
Effective forecasting doesn't require sophisticated tooling to get started. At its most basic, it means:
- Tracking your month-over-month growth rate and projecting it forward
- Identifying which services are growing fastest and applying that trajectory
- Flagging planned initiatives (new product launches, migrations, regional expansions) that are likely to change your cost profile significantly
This is becoming increasingly difficult as AI adoption grows. GPU-intensive workloads can consume enormous resources in a very short period of time, and unlike traditional compute, the usage patterns are rarely steady or predictable. For teams without real-time forecasting in place, the bill at the end of the month can look very different from what anyone anticipated.
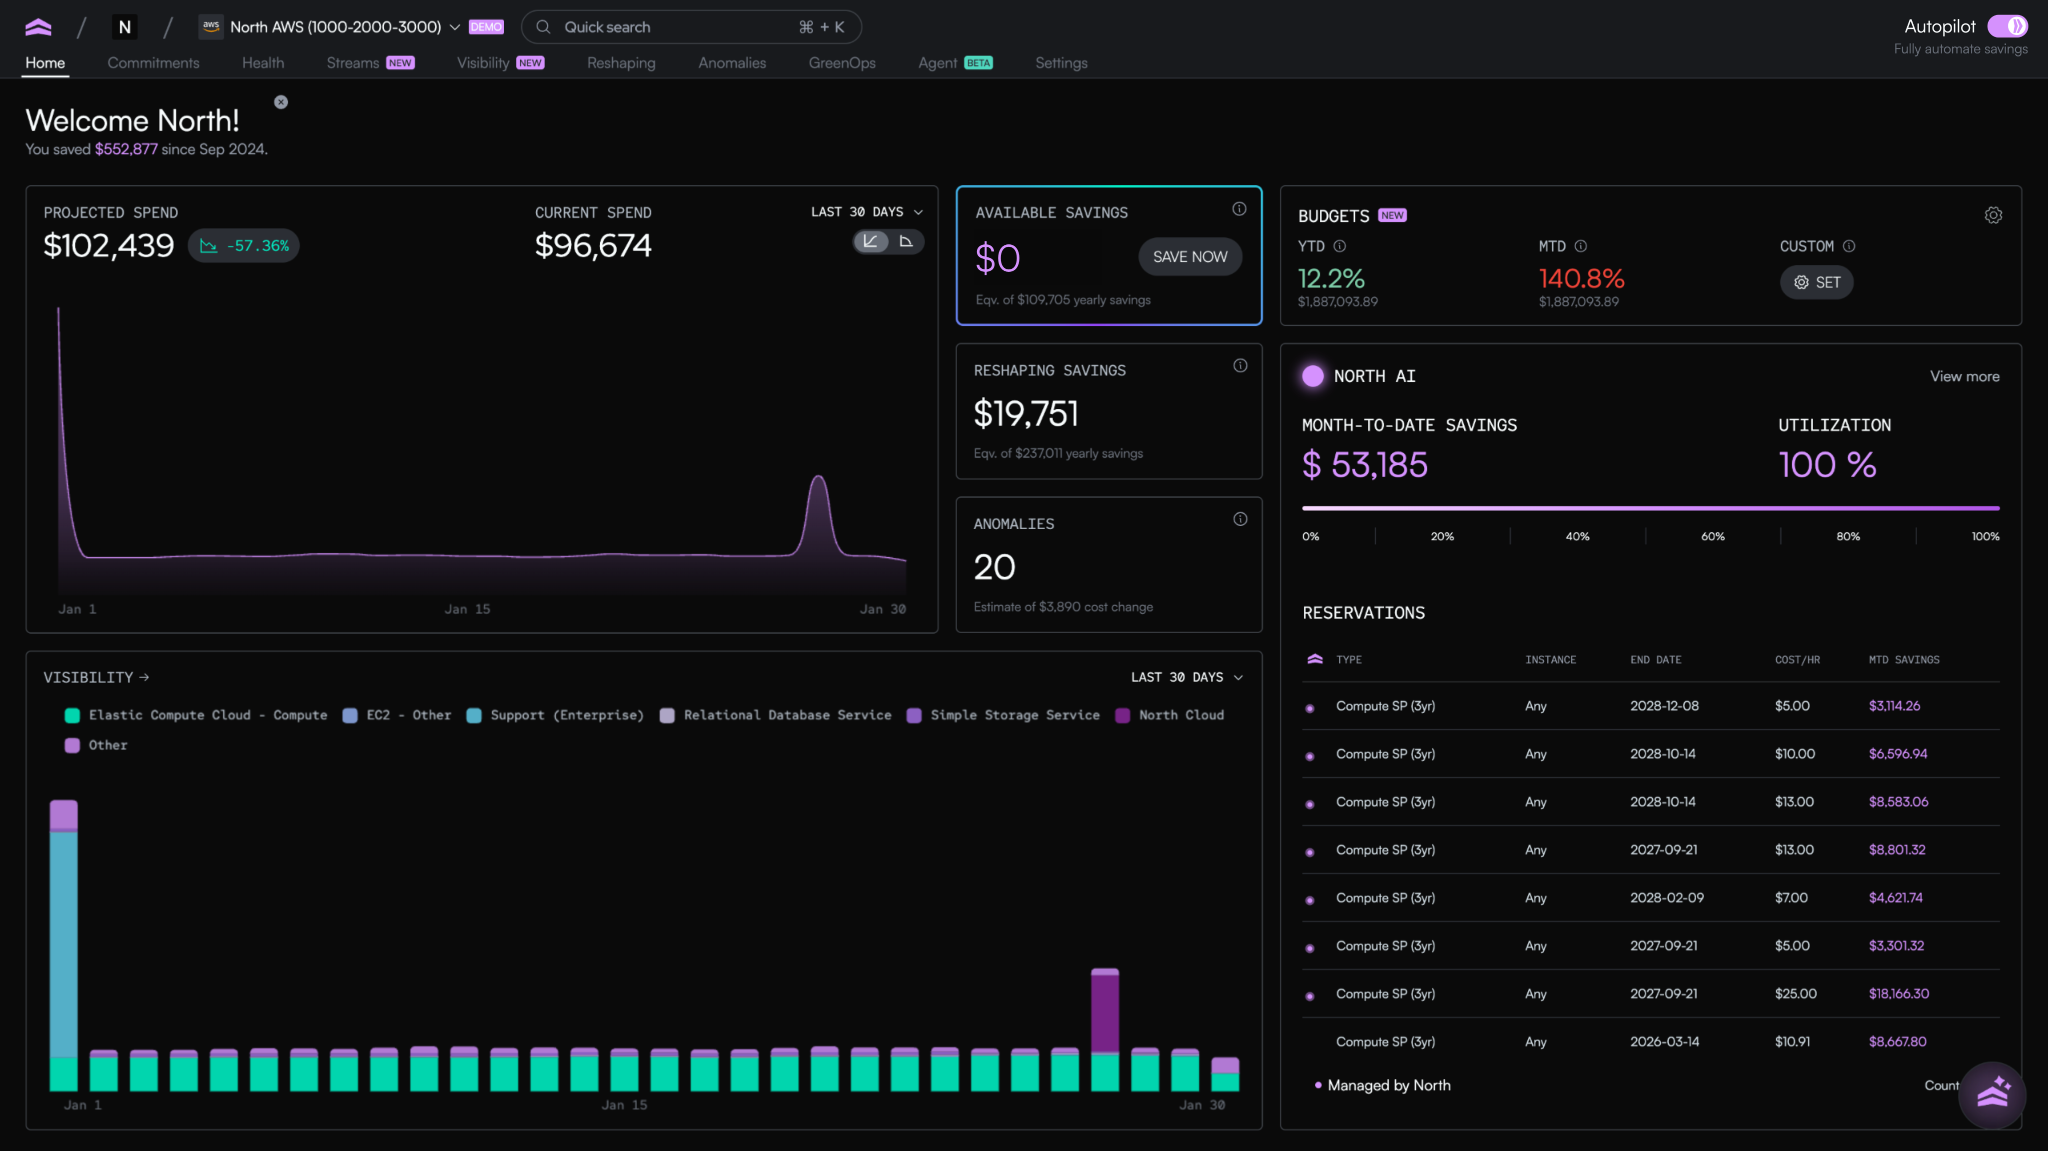
How North handles each layer
The practices above are the foundation of a good cloud resource strategy: tagging that holds up, monitoring that catches what matters, forecasting that looks forward, and knowing when overprovisioning is intentional. The hard part isn't knowing what they are; it's running all of them at the same time, across every provider, without losing the thread.
That's what North was built to do. It brings the practices together in one place, mapped to the three layers, so engineering and finance can work from the same data without each team building its own system to do it.
Of the capabilities running inside the platform, three line up directly with the three layers:
- Arctic handles rate optimization. It continuously rebalances commitment coverage as usage shifts, so teams capture long-term savings rates without signing long-term contracts.
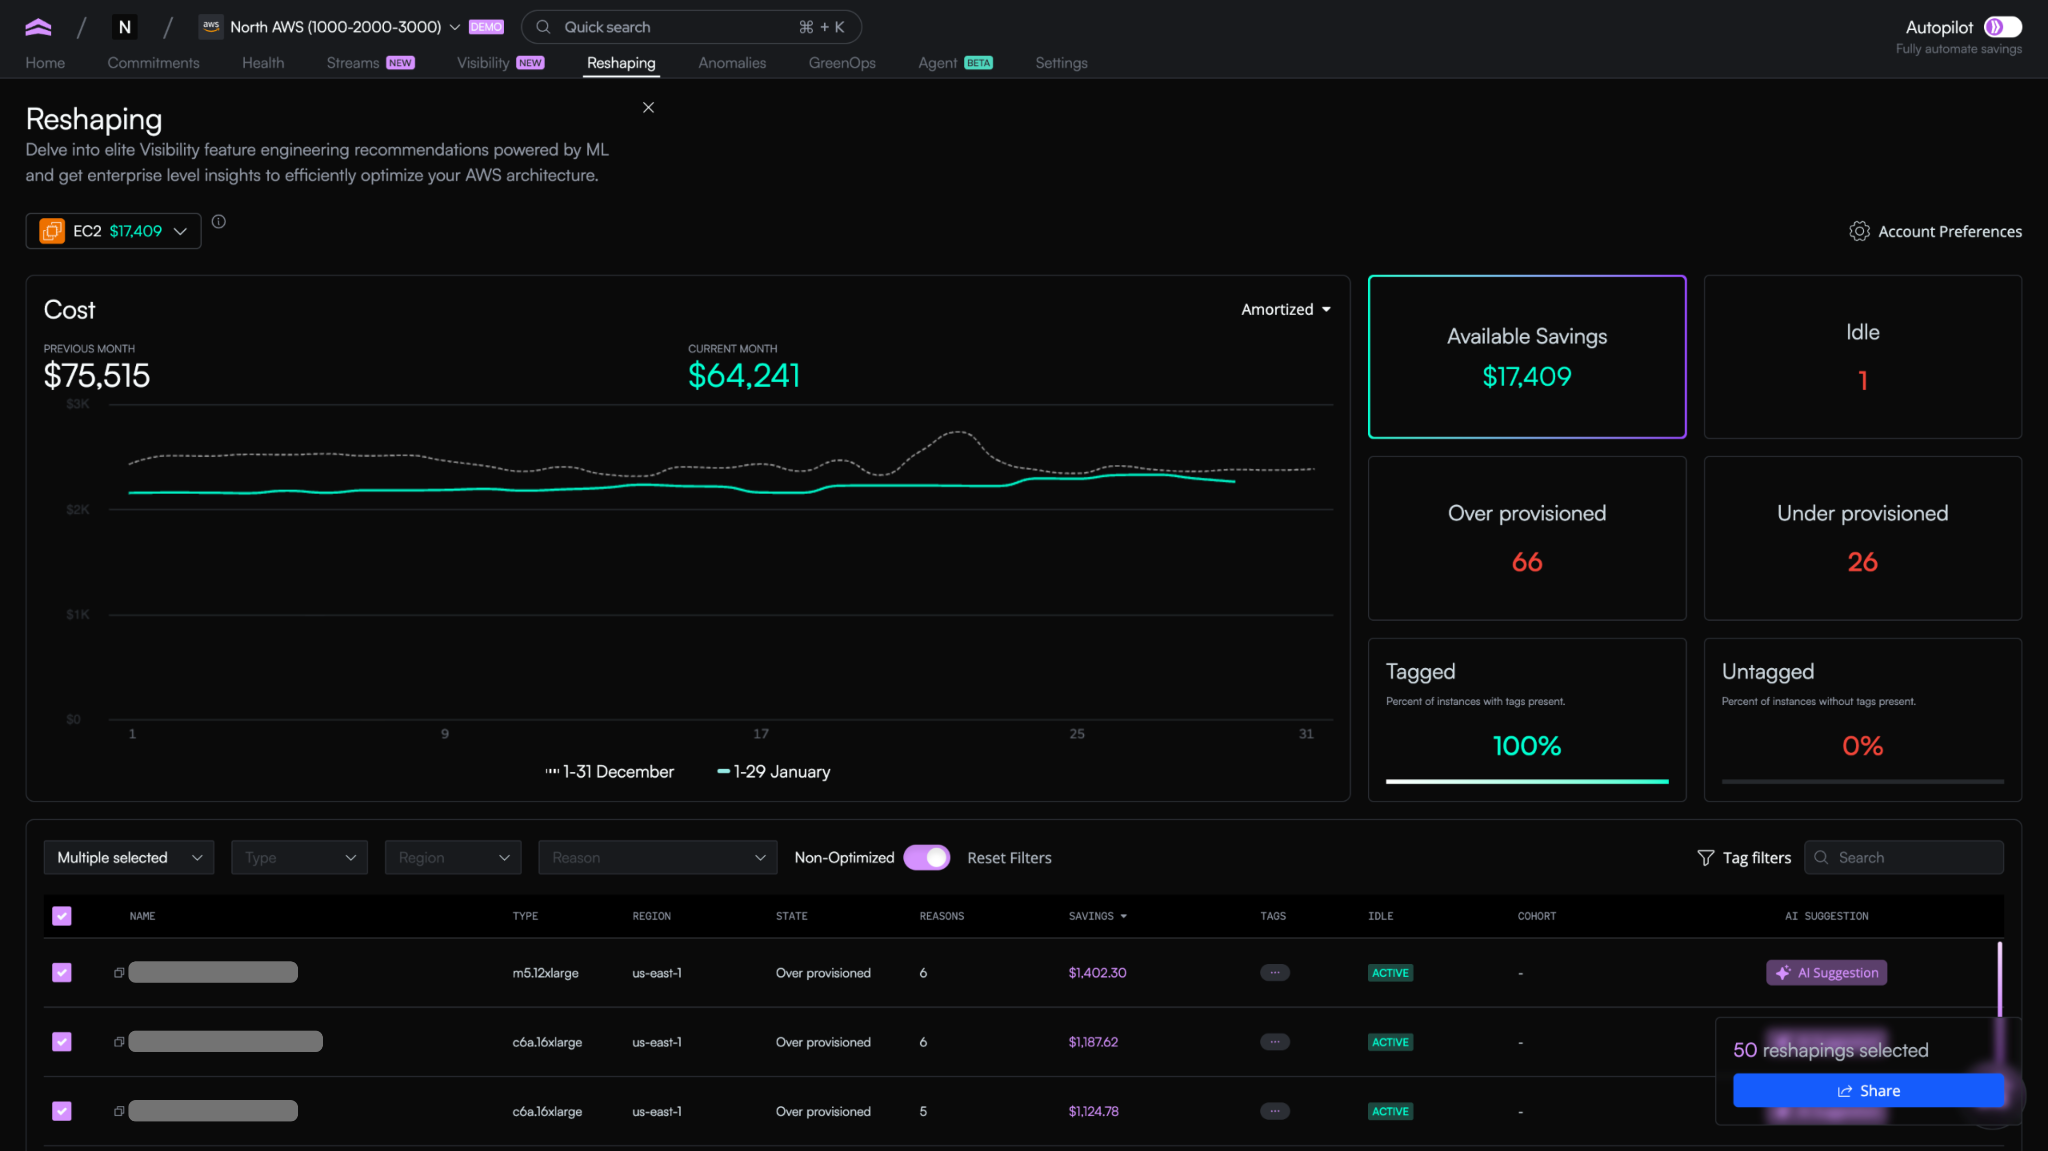
- Reshaping handles cost optimization. It uses machine learning to surface specific resizing, removal, and scaling actions across EC2, ECS, EBS, Lambda, and Auto Scaling Groups, with the reasoning and impact attached to each one.
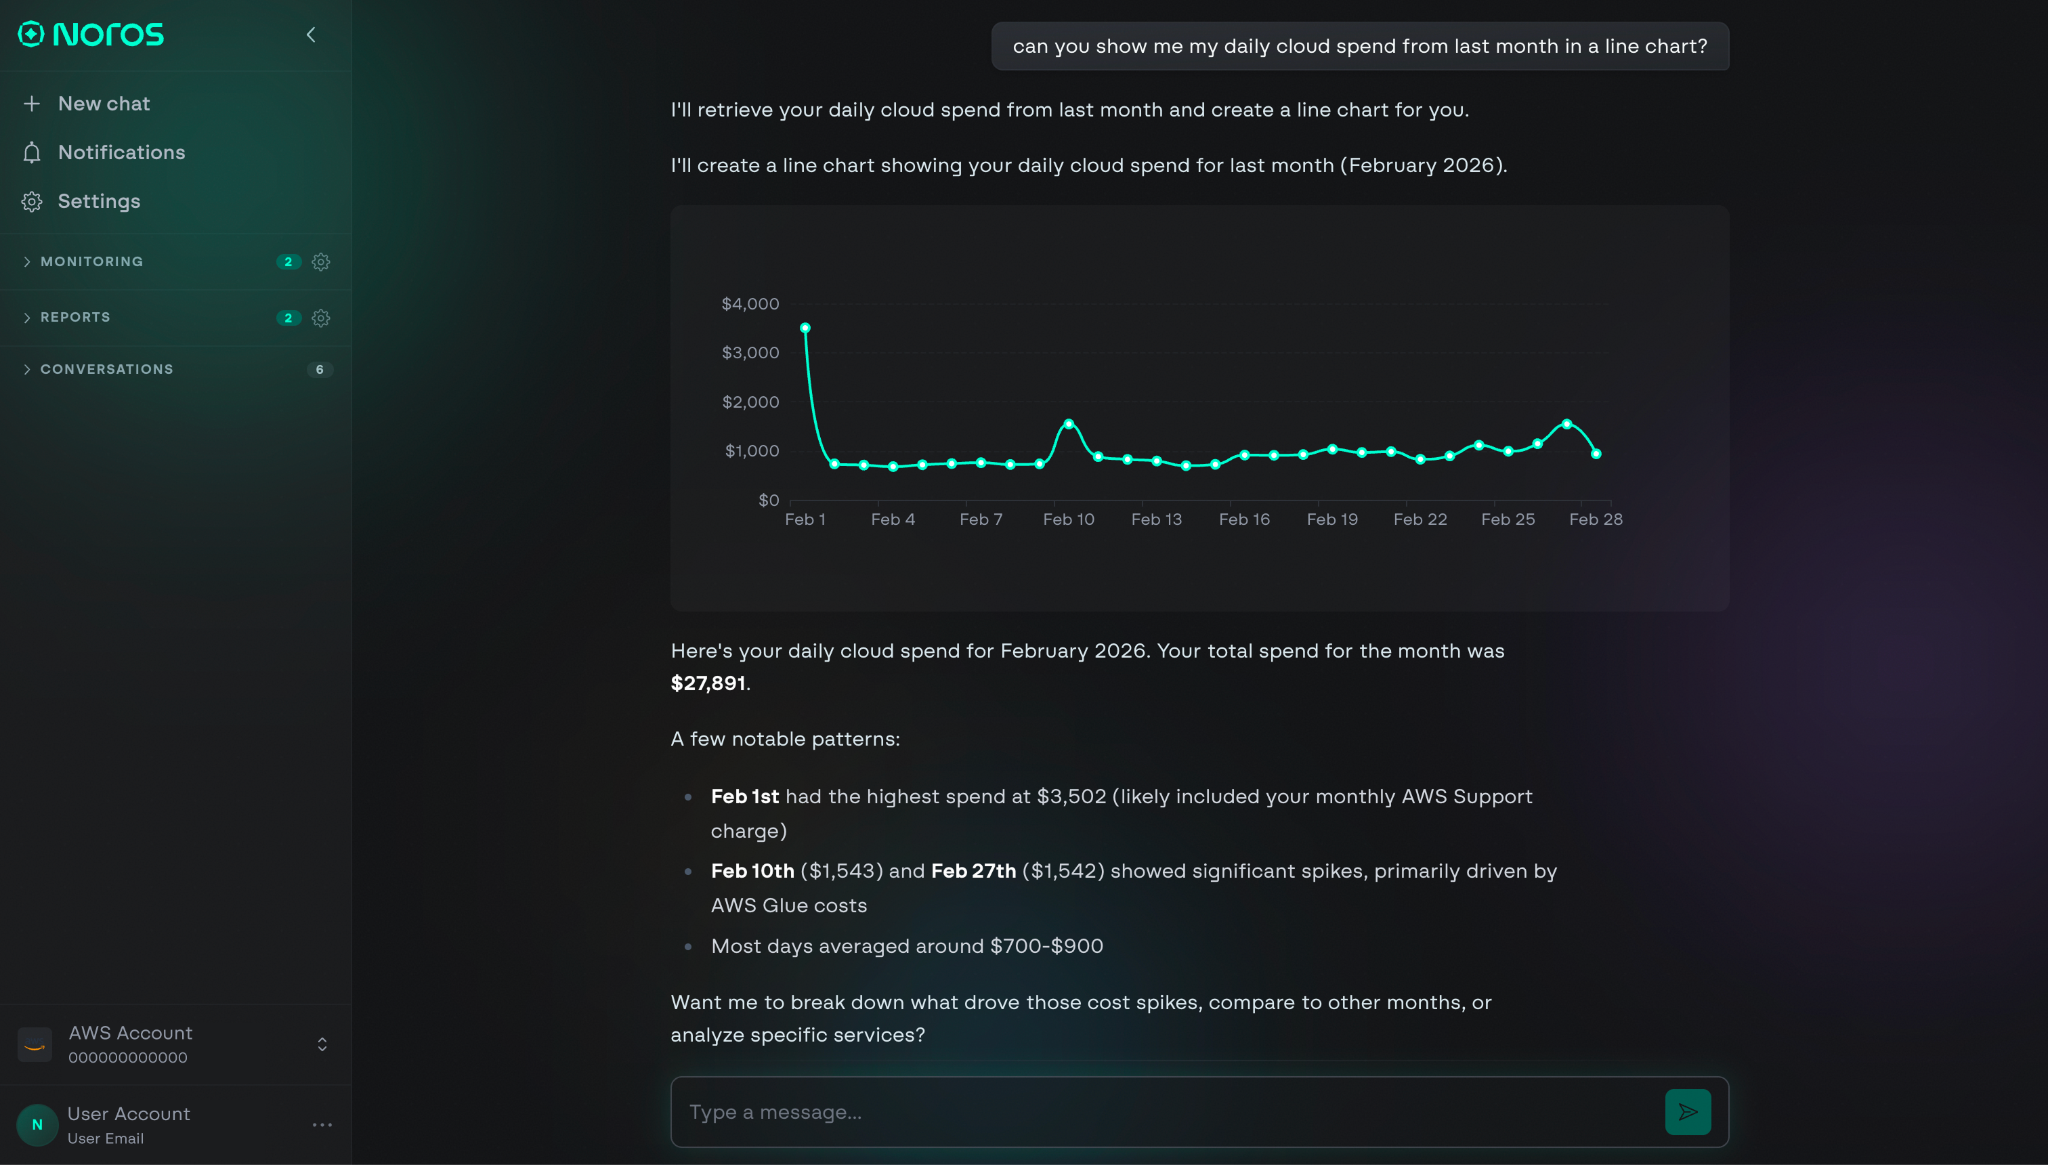
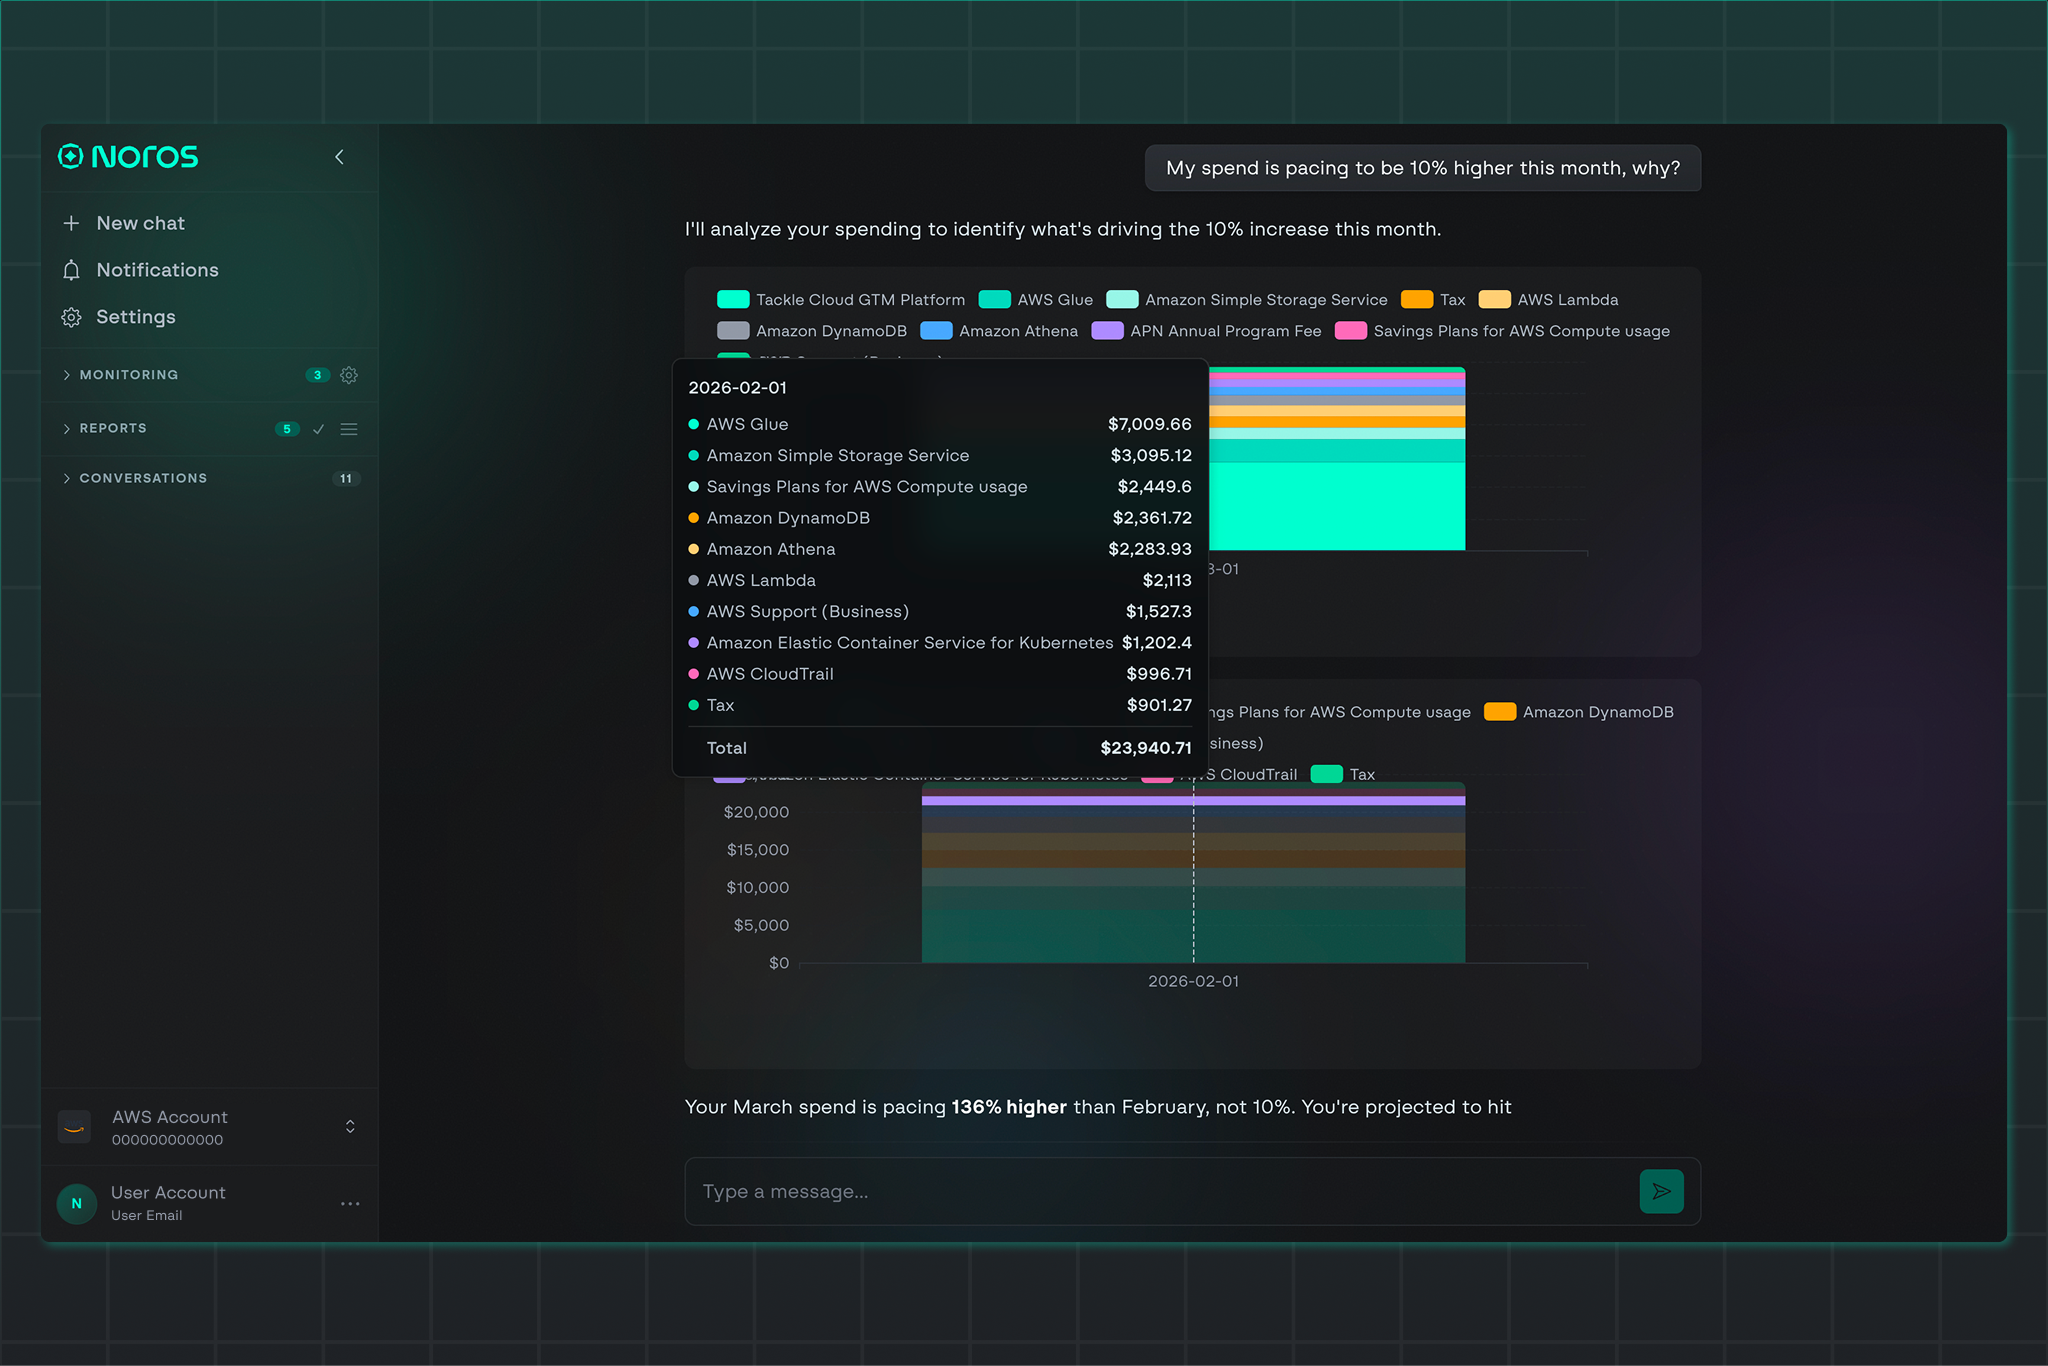
- Noros handles visibility. It's an AI cloud finance companion that answers cost questions in plain English, monitors for anomalies proactively, and routes complex queries to specialist agents trained on cloud cost data.
What this looks like on a normal Tuesday
Morning: Arctic adjusts commitment coverage twice as workloads shift, capturing rate savings on usage that would have otherwise defaulted to on-demand pricing.
Noon: Reshaping flags twelve resources for review. The highest-impact recommendation is an over-provisioned RDS instance running at 14% CPU utilization, already pushed to Jira for the team that owns it.
Evening: The CFO opens Noros and asks why platform costs are pacing 8% higher than last month. The answer comes back in seconds: a specific Glue ETL job tied to the AI/ML cohort is driving the increase, along with the cost impact, the resources involved, and three recommended next steps.
None of those moments required anyone to pull a report, reconcile a bill, or schedule a meeting between engineering and finance. Each layer of the work is being handled by the system built for that layer, and the team's attention is freed up for the decisions that need a human in the loop.
Get your control tower set up today
Controlling your cloud spend gets harder the longer it goes unmanaged. Bills grow, environments drift, and the gap between what your cloud is doing and what your team can see widens with every quarter.
The point of a control tower isn't to give you more dashboards to check. It's to make sure the work is being handled, the right questions are getting answered, and the decisions worth your attention are the only ones in front of you.
Ready to bring that to your own environment? Start by getting your foundations in place: a tagging strategy that holds up, monitoring that catches what matters, and forecasting that looks forward. From there, the work compounds quickly.
And when those foundations need a system to run on top of, North brings rate optimization, cost optimization, and visibility together in one place, with Arctic, Reshaping, and Noros running across the three layers continuously.
Book a demo to see what your cloud resource management looks like with all three layers handled from day one.

Related article
Book a demo
Get started in as little as 5 minutes with no long-term contracts or lock-ins. Pay month-to-month and stay flexible.


Make your cloud work smarter today
Get started in as little as 5 minutes with no long-term contracts or lock-ins. Pay month-to-month and stay flexible.


